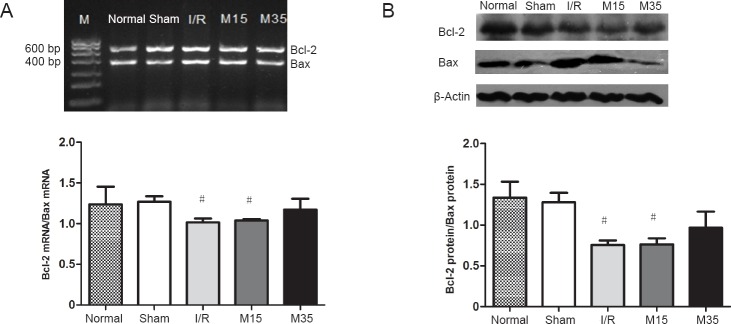
Figure 5.
Gene and protein expression levels of Bcl-2 and Bax in the injured rat cortex.
The cortical tissues were prepared on day 3 after sham surgery or after I/R (2 hours of middle cerebral artery occlusion followed by 3 days of reperfusion). (A) Representative image and quantitative analysis of the densitometric values of Bcl-2 and Bax mRNA levels in the rat cortex detected by reverse transcription-polymerase chain reaction after 3 days of reperfusion. (B) Representative western blots and quantitative analysis of the densitometric value of the protein levels of Bcl-2 and Bax (β-actin, control protein) in the rat cortex after 3 days of reperfusion. Data are presented as the mean ± SEM (n = 3) and analyzed using one-way analysis of variance followed by Dunnett's test. #P < 0.05, vs. sham group. M: DNA marker. Normal: normal group; Sham: sham surgery group; I/R: I/R group; M15: 15-minute moxibustion group; M35: 35-minute moxibustion group.

