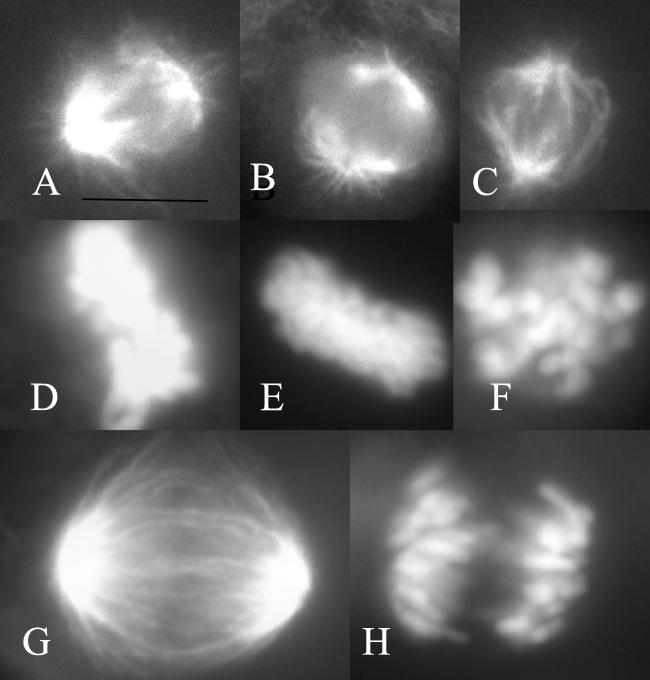
Figure 3.
Mitotic spindle organization. (A and D) A549 cells; (B and E) A549-T12 cells in 12 nM Taxol; (C and F) A549-T12 cells in the absence of added Taxol; (G and H) anaphase in A549-T12 cells in 12 nM Taxol. (A–C, G) Spindle microtubules as shown by antitubulin immunofluorescence. (D–F, H) Chromosomes of the same cells as shown by 4,6-diamino-2-phenylindole stain. (Bar = 10 μm.)

