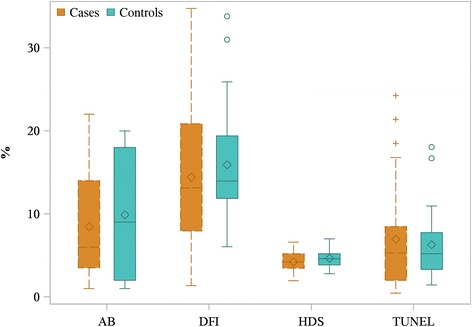
Fig. 2.

Evaluation of sperm nuclei in men with URPL and controls. Data are presented as median [q1–q3] boxplot (median is represented as the line under the boxplot, the mean as the diamond, q1 and q3 as the border of the box, and circles represent the outliers). AB, aniline blue staining; DFI, DNA fragmentation index; HDS, high DNA stainability; TUNEL, terminal deoxynucleotidyl transferase dUTP nick end labeling
