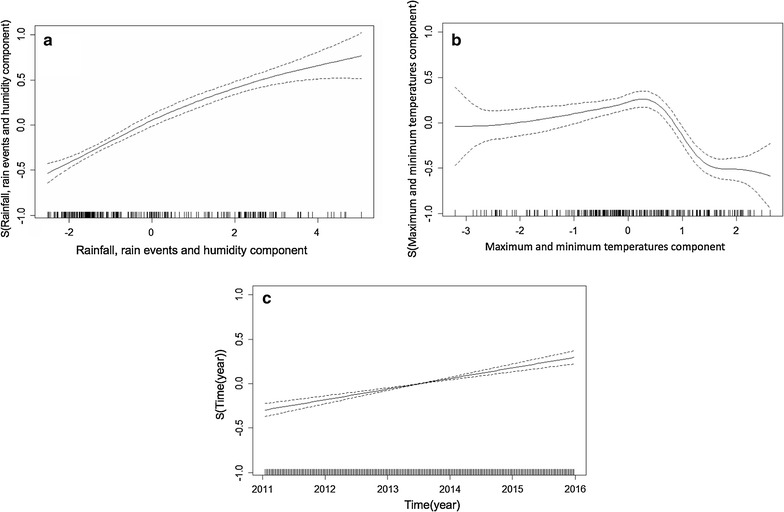
Fig. 3.

Relationship between malaria incidence and the first meteorological factor (rainfall, rain events, humidity), the second meteorological component (maximum and minimum temperatures), and time. The continuous black curves represent adaptive smooth relationships of malaria incidence according to the first meteorological component (a), the second meteorological component (b), and time (c), with a CI of 95% (dashed black curves)
