Figure 2.
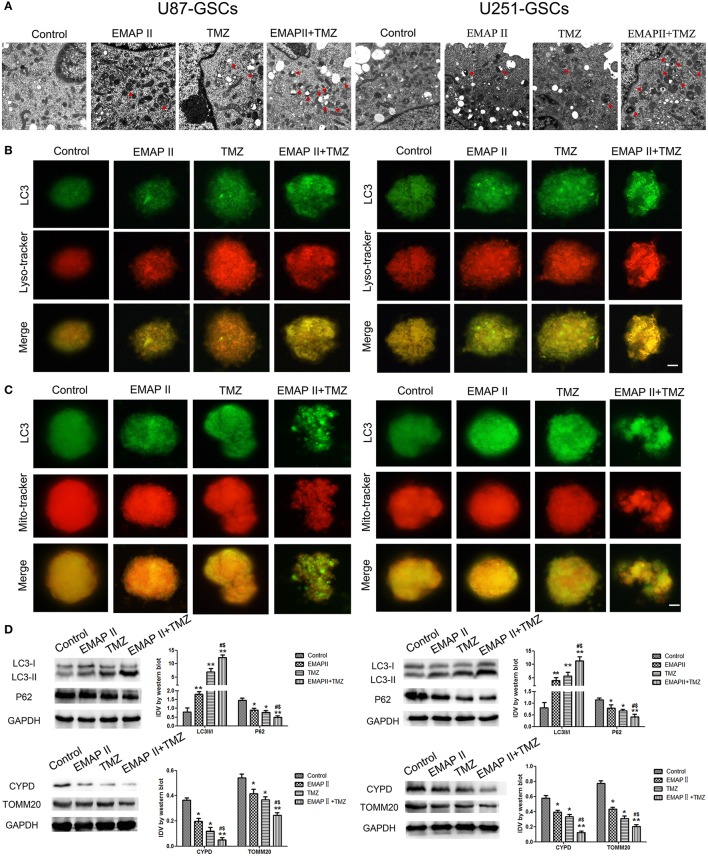
The effects of EMAP-II and TMZ on mitophagy in U87-GSCs and U251-GSCs. (A) Representative TEM image of autophagosomes in U87-GSCs and U251-GSCs treated with EMAP-II and TMZ. Autophagysome activity levels were gradually increased in the EMAP-II and TMZ groups and the EMAP-II and TMZ combination group. Scale bar corresponds to 1 μm. (B,C) The distribution and expression of LC3 in U87-GSCs and U251-GSCs treated with EMAP-II and TMZ were analyzed by immunofluorescence assay with Lyso-Tracker and Mito-Tracker. The expression of LC3 indicates the occurrence of autophagy. The distribution of LC3 that overlap with lysosome or mitochondria indicates autophagy or mitophagy. Scale bars represent 20 μm. (D) Western blot analysis of the LC3-II/I ratio and P62, TOMM 20, and CYPD expression levels in U87-GSCs and U251-GSCs treated with EMAP-II and TMZ. The LC3-II/I ratio increased, but P62, TOMM 20, and CYPD expression decreased in GSCs treated with EMAP-II and TMZ. Data are presented as the mean ± SD of n = 3. *P < 0.05, **P < 0.01 vs. control group, #P < 0.05 vs. TMZ group, &P < 0.05 vs. EMAP-II group.

