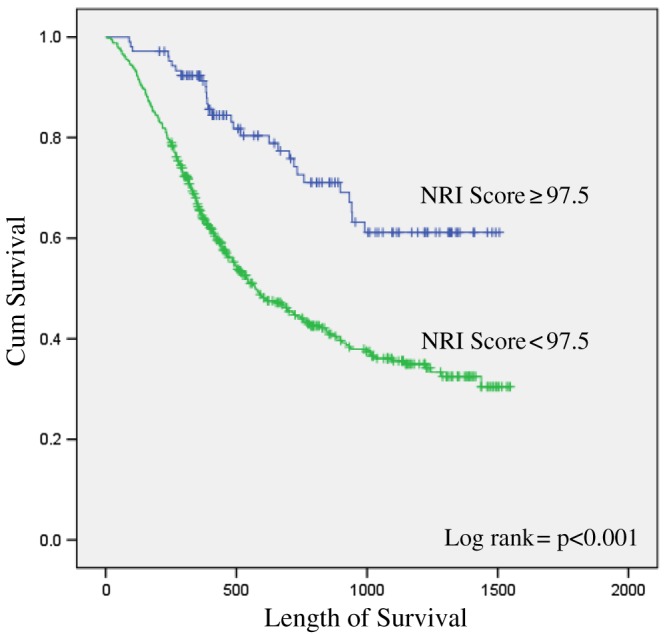
Figure 3.

Kaplan–Meier curve comparing the survival of those with a Nutritional Risk Index (NRI) ≥ 97.5 vs. those with a NRI < 97.5.

Kaplan–Meier curve comparing the survival of those with a Nutritional Risk Index (NRI) ≥ 97.5 vs. those with a NRI < 97.5.