Figure 10.

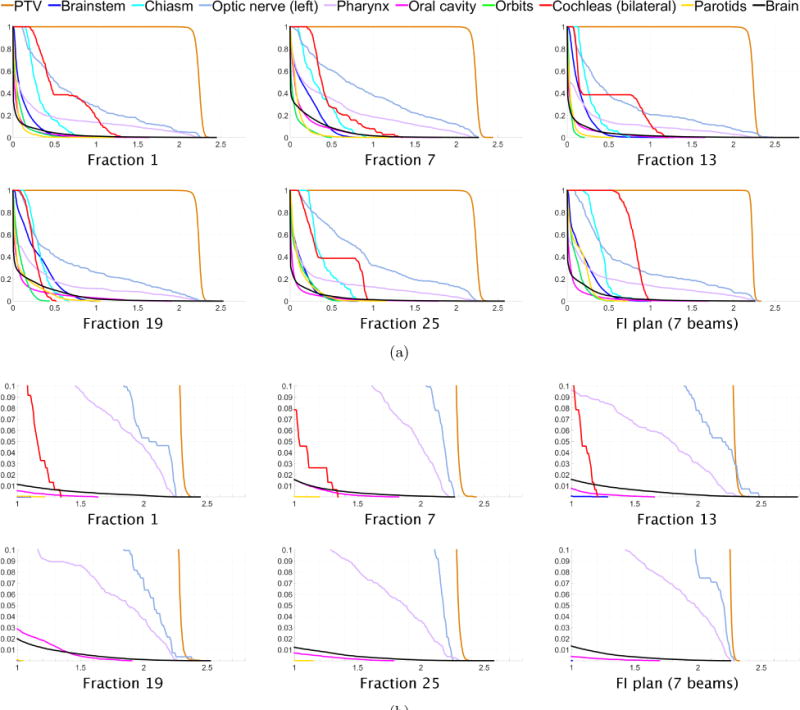
(a) Dose-volume histograms for five of the 30 treatment fractions for head and neck case “H&N”. The DVH for one fraction of the 7-beam FI plan is shown in the lower right. (b) Close-up views of the high dose range for the DVHs in (a).

(a) Dose-volume histograms for five of the 30 treatment fractions for head and neck case “H&N”. The DVH for one fraction of the 7-beam FI plan is shown in the lower right. (b) Close-up views of the high dose range for the DVHs in (a).