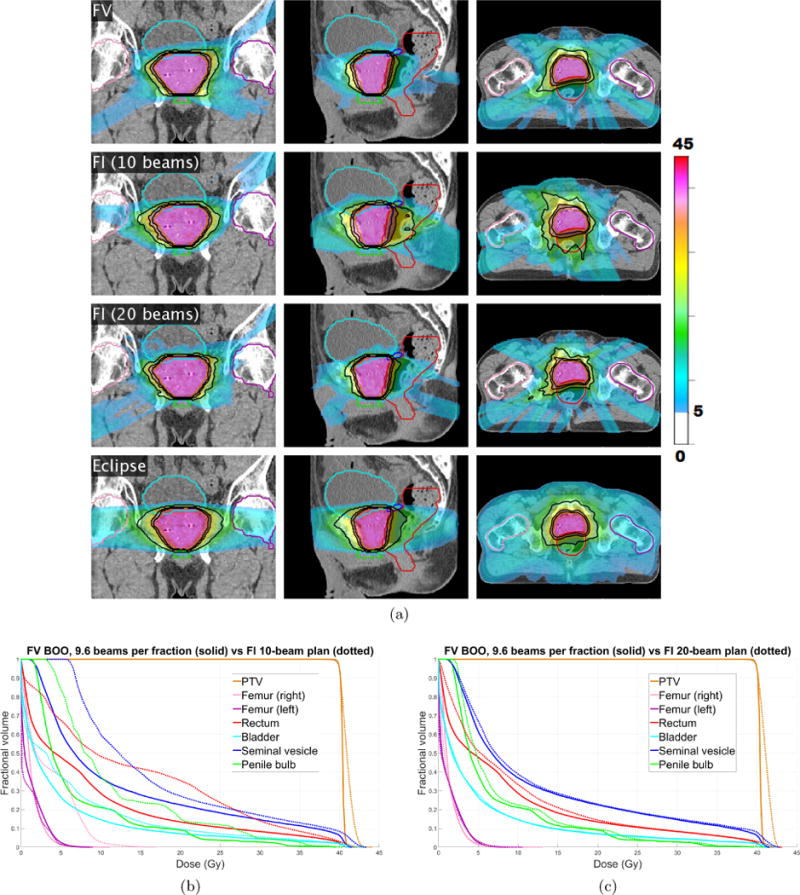
Figure 7.

(a) The cumulative dose distribution (summed over all five fractions) for the FV plan using average of 9.6 beams per fraction (first row) as well as a 10-beam FI plan (second row) and a 20-beam FI plan (third row). A VMAT plan made using Eclipse is shown in the fourth row. Isodose lines for 50%, 80%, and 95% of the prescription dose are shown in black. Dose below 5 Gy is not shown. (b)–(c) Dose-volume histograms for prostate case “PRT”, comparing FV plan that uses 9.6 beams per fraction (solid) with FI plans (dotted) using (b) 10 beams, and (c) 20 beams.
