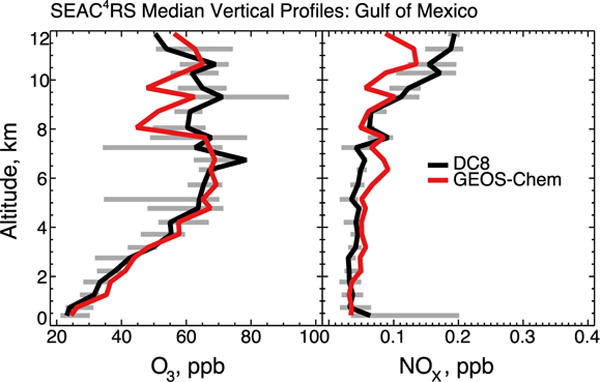
Figure 11.

Median vertical profiles of ozone and NOx concentrations over the Gulf of Mexico during SEAC4RS. Observations are from four SEAC4RS flights over the Gulf of Mexico (August 12, September 4, 13, 16). GEOS-Chem model values are sampled along the flight tracks. The 25th and 75th percentiles of the aircraft observations are shown as horizontal bars.
