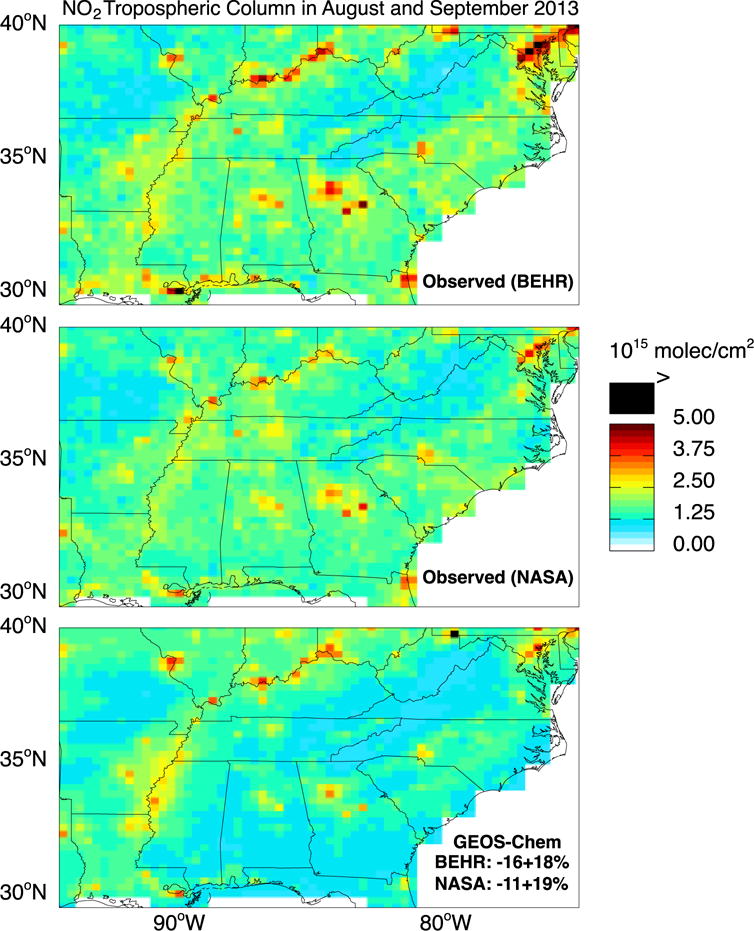
Figure 5.

NO2 tropospheric columns over the Southeast US in August–September 2013. GEOS-Chem (sampled at the 13:30 local time overpass of OMI) is compared to OMI satellite observations using the BEHR and NASA retrievals. Values are plotted on the 0.25°×0.3125° GEOS-Chem grid. The GEOS-Chem mean bias over the Figure domain and associated spatial standard deviation are inset in the bottom panel.
