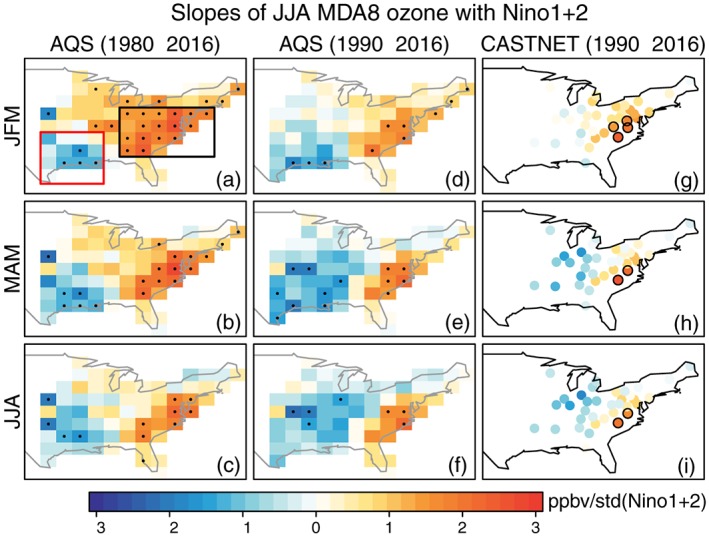
Figure 2.

Slope of JJA AQS ozone with standardized Niño 1 + 2 index in (a) Jan‐Feb‐Mar, (b) Mar‐Apr‐May, and (c) Jun‐Jul‐Aug for 1980–2016. (d–f) Same as in Figures 2a–2c but for the 1990–2016 timeframe. (g–i) Same as in Figures 2d–2f but using the ozone observations in CASTNET. All data are detrended by subtracting the 7 year moving averages. The grid boxes with statistically significant correlations (p ≤ 0.1) are stippled in Figures 2a–2f or circled in Figures 2g–2i. The black and red rectangles in Figure 2a are used to define the ozone dipole pattern as discussed in Figure S4.
