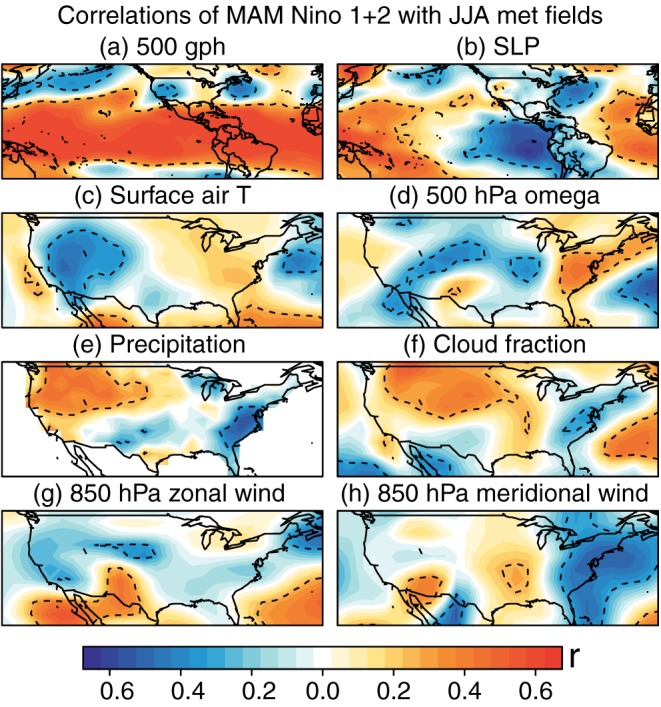
Figure 3.

Correlation of MAM Niño 1 + 2 with JJA atmospheric teleconnections, including (a) 500 hPa geopotential heights and (b) sea level pressures, from 1980 to 2016. (c–h) Same as in Figures 3a and 3b but for other meteorological variables over the United States. The positive values denote subsidence in Figure 3d, eastward wind in Figure 3g, and northward wind in Figure 3h. All data are detrended by removing the 7 year moving average. The dashed contour lines enclose regions in which the correlations reach statistical significance (p < 0.10).
