
Fig. 1.
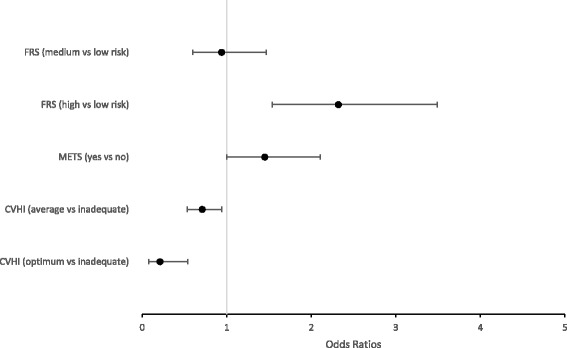
Results from logistic regression analysis assessing the association between clinical and risk scores and subclinical atherosclerosis‡.
‡Results displayed as the Adjusted Odds Ratio and 95% Confidence Interval, with analysis conducted while applying sampling weights to the study sample; Framingham Risk Score models adjusted for race and education; Metabolic syndrome models adjusted for sex, age, race, smoking, and education; Cardiovascular Health Index models adjusted for sex, age, race, and education