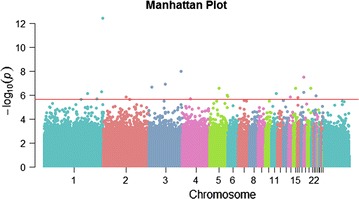
Fig. 1.

Manhattan plot of differentially-methylated (DM) windows between selection lines. All 990,000 windows were plotted with genomic location on the X-axis and negative log10 p values on the Y-axis. The red horizontal line indicates the threshold for significantly DM windows at p < 0.1 after FDR correction. Microchromosome labels were filtered out for readability
