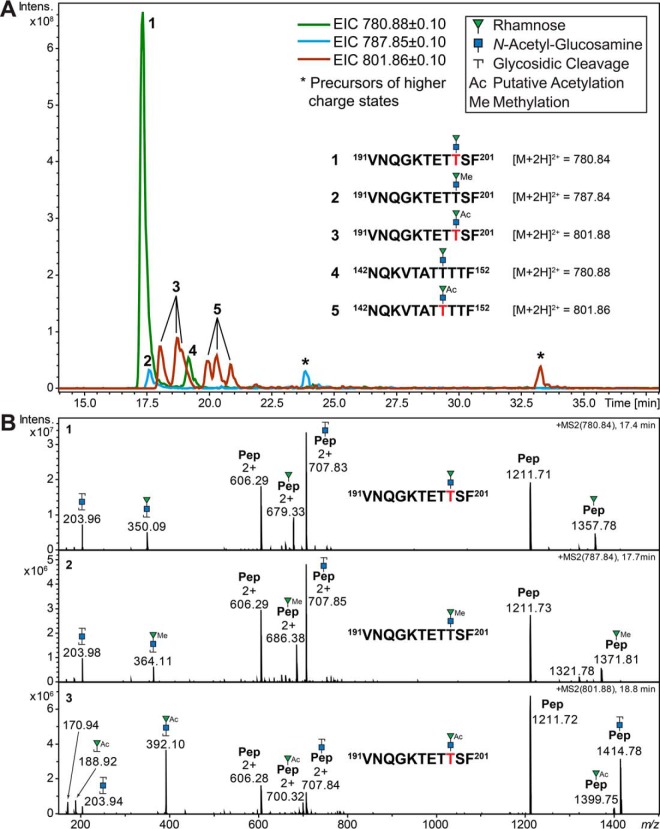
Fig. 5.
Example of glyco-microheterogeneity shown for five selected glycopeptides with a peptide backbone mass difference of just 0. 036 Da (191VNQGKTETTSF201, M = 1210.583 Da and 142NQKVTATTTTF152, M = 1210.619 Da). A, Extracted ion chromatograms (EIC) showing three m/z values reflecting the RhaGlcNAc disaccharide and its modifications (methylation and putative acetylation) attached to the two peptide backbones. Although the nonmodified disaccharide is the dominant form on glycopeptide 191–201, the later eluting glycopeptide 142–152 shows higher levels of putative acetylation. A single peak was detected for the methylated version of glycopeptide 191–201, but none for glycopeptide 142–152. Both glycopeptides exhibited three peaks for the putative acetylated glycoform, possibly indicating that different hydroxyl groups are modified on the rhamnose (see also (B)) in a site-specific manner. B, Representative CID product ion spectra for the three glycoforms of glycopeptide 191VNQGKTETTSF201. The oxonium ions clearly indicate that methylation (364.1 Da) and putative acetylation (392.1 Da) are exclusively occurring on the nonreducing end rhamnose. The native disaccharide and its methylated form exhibited a strong pseudo Y1-glycopeptide signal reflecting the peptide plus one Rha that is best explained by a Rha rearrangement (signals at 679.332+/1357.78+ and 686.382+/1371.81+, respectively). This is almost entirely abolished when the Rha residue is modified by putative acetylation (bottom spectrum). Red letters indicate sites of glycosylation unambiguously identified in separate ETD product ion spectra (see also Fig. 6 and supplemental Fig. S5).

