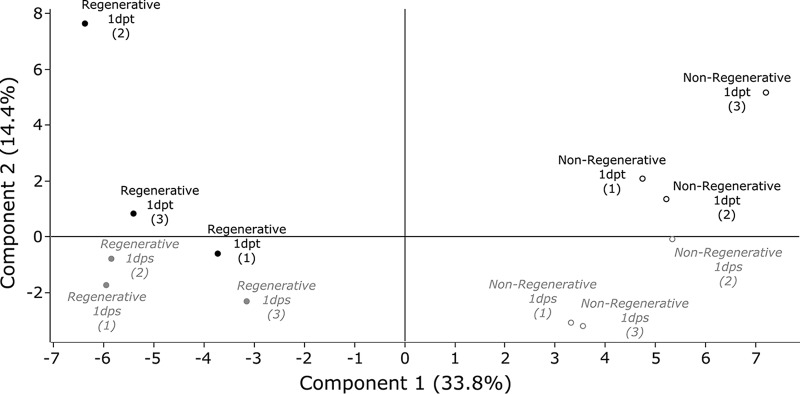
Fig. 2.
Principal Component Analysis. Reporter ion intensities for transected and sham operated samples were normalized against uncut samples, and principal component analysis performed on normalized values. Regenerative (●) and nonregenerative stage (○) samples were separated along component 1, and 1 day after transection (1dpt, black) and 1 day after sham-operation (1dps, gray) samples separated along component 2. Percentages (%) indicate the percentage of variance that each principal component represents.

