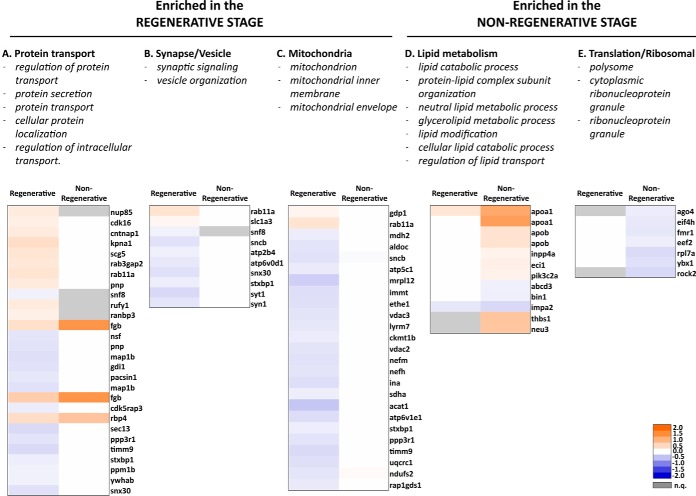
Fig. 5.
Heatmaps showing differential expression changes for proteins belonging to enriched gene ontology (GO) categories. Gene ontology terms were classified into 5 groups (A–E). Specific GO terms included in each group are listed below. n.q. protein was not quantified (gray boxes). Color scale represents log2 (transected/sham) fold-change values with significant differential expression (p value < 0.05). Fold-changes with nonsignificant p value (≥ 0.05) are shown in white.

