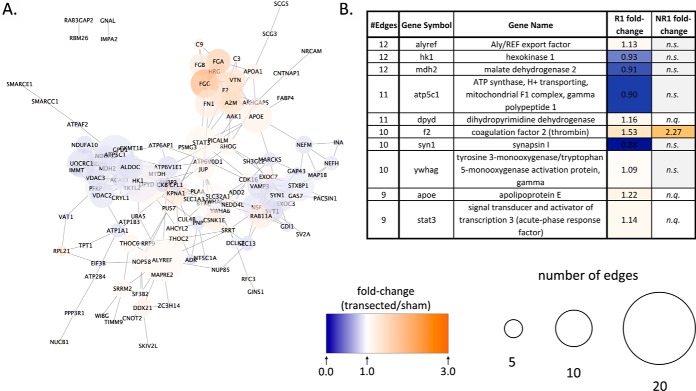
Fig. 6.
STRING network analysis for differentially expressed proteins in the R-stage. STRING network analysis for proteins meeting differential expression criteria (see Fig. 3 legend) in the regenerative stage. A, STRING network. Fill color represents fold-change, and node size represents the number of edges (or undirected connections) each protein has. B, List of most highly connected proteins and their See both scales in bottom-right corner.

