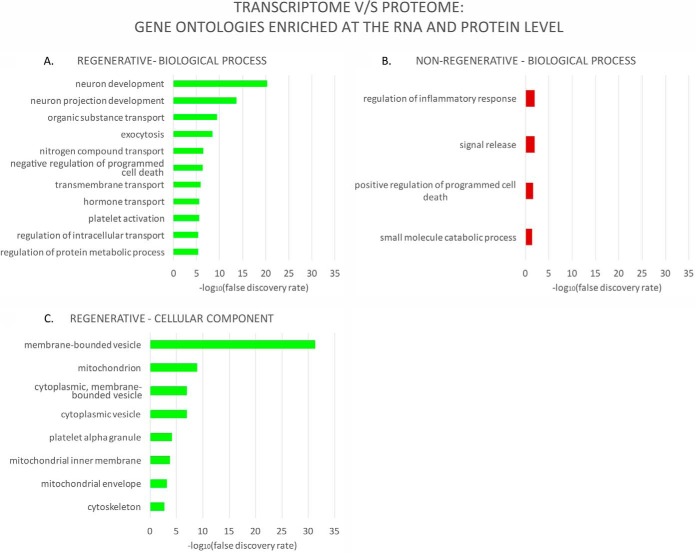
Fig. 8.
Gene ontology (GO) categories enriched at both the transcriptome and proteome levels. A list of GO terms enriched among differentially expressed genes, in both previously published RNA-Seq data (8) and the present iTRAQ data was generated, after which level 5 GO terms were selected and their enrichment false discovery rate (FDR) value obtained from iTRAQ data. As in Fig. 4, terms were also filtered to include only level 5 terms exclusively found in either stage. When more than 10 exclusive GO terms were found, only the top 10 with the lowest FDR value were included in the graph (see Table I and supplemental data 6 for additional information). Note: cellular component for the nonregenerative stage is not shown because there were no level 5 terms exclusively found in this stage in this analysis.

