Fig. 2.
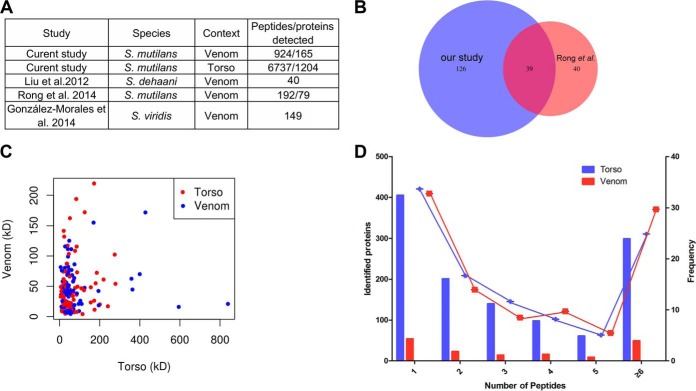
Comprehensive profiles of the centipede proteome. A, Comparison of previously reported centipede proteomes to the proteome described in our study. The numbers of detected proteins/peptides in previous studies are shown. B, Venn diagram comparing identified and shared peptides/proteins from S. mutilans between our proteome and the proteome reported by Rong et al. C, The plot shows the molecular weights of proteins identified in the proteomes from centipede venom and torso tissues. The red or blue dots depict different proteins from venom and torso tissues, separately. D, Histogram displaying the number of peptides matched to proteins. The x axis illustrates the number of identified peptides. The primary y axis indicates the number of identified proteins (bars). The right y axis represents the percent (lines).

