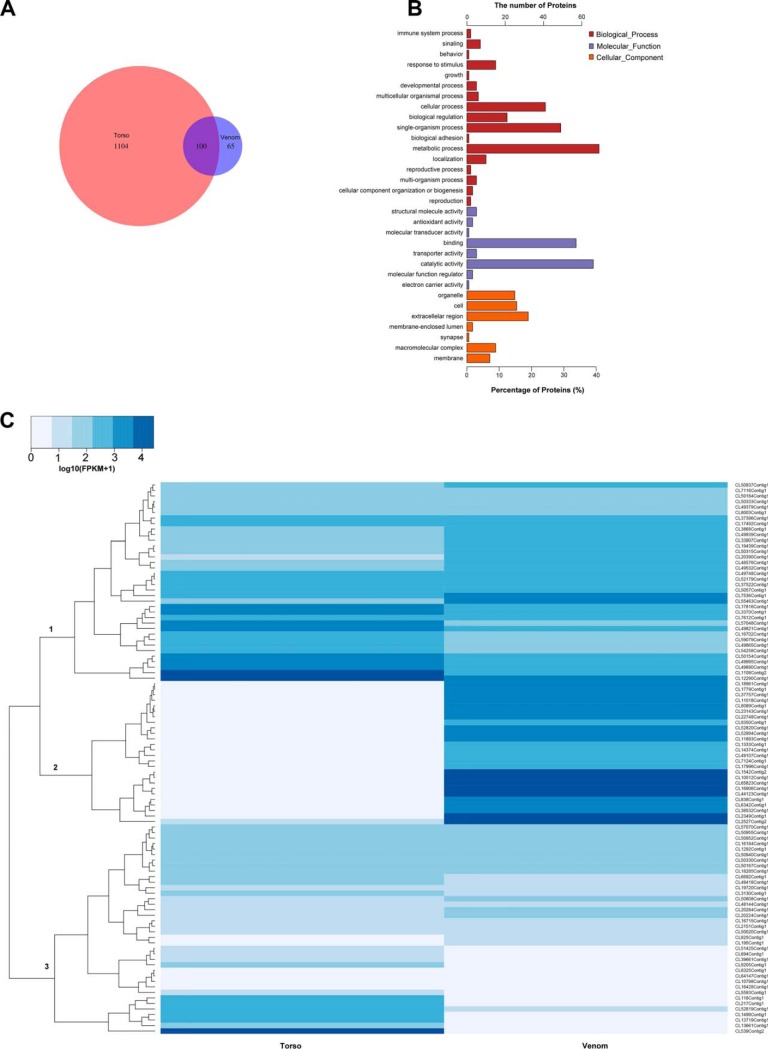
Fig. 3.
Comparison of the venom and torso proteomes. A, Venn diagram representing the overlapping proteins from the venom and torso tissues. B, Functional annotation of proteins identified in venom. One hundred sixty-five proteins from venom were annotated with GO (Gene Ontology) terms and enriched for biological process, molecular function and cellular component. C, Heat map of 100 overlapping proteins showing differences in expression among venom gland and torso tissues.

