Fig. 5.
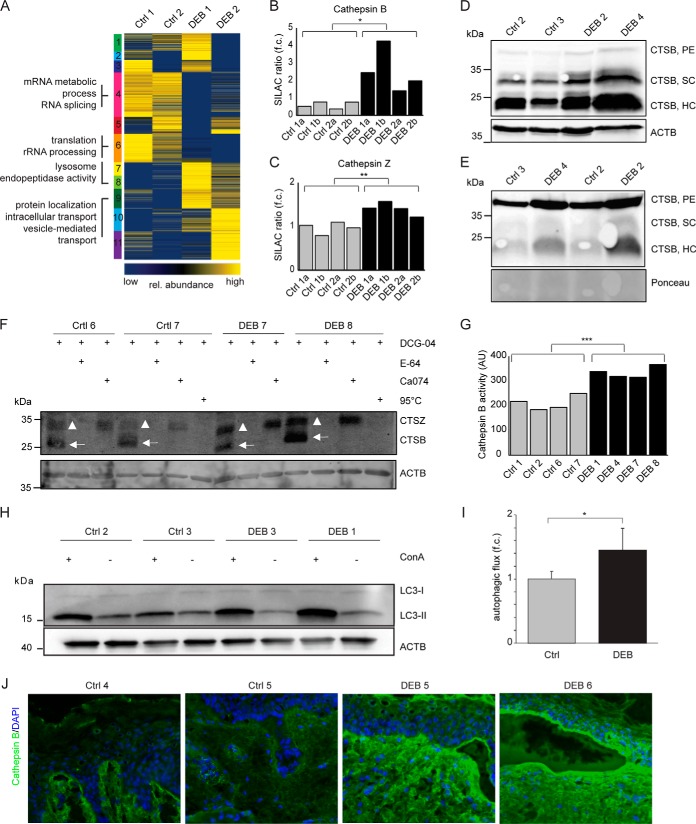
Increased cathepsin B abundance and activity in DEB keratinocytes. A, Cluster analysis of intracellular protein abundances. SOTA clustering of intracellular proteins that were quantified in DEB keratinocytes compared with controls. Protein ratios were log2-transformed and z-score normalized. Proteins in each cluster were tested by DAVID for enriched GO terms (biological process (BP), cellular compartment (CC) and molecular function (MF). Selected terms are shown (full list in supplemental Table S7). B–C, Protein abundance measurements. Protein abundances of cathepsin B (B) and cathepsin Z (C) were significantly higher in DEB compared with control keratinocytes as determined by SILAC-based, quantitative MS (t test, two-tailed, two-sample equal variance, p < 0.05). a and b: biological replicates of indicated primary cells analyzed by swapped SILAC labels. D–E, Western blot analysis revealed higher amounts of cathepsin B in DEB keratinocytes. Higher abundance of the cathepsin B single-chain enzyme (SC) and the heavy chain of the two-chain enzyme (HC) were detected in DEB whole cell lysates of independent biological replicates by Western blot (D). In conditioned keratinocyte medium increased amounts of proenzyme (PE) and active cathepsin B (HC form) were detected under DEB conditions (E). F, Cathepsin B activity assays revealed more active cathepsin B in DEB keratinocytes. Bands corresponding to active cathepsins B and Z are highlighted by arrows and triangles, respectively. Biotin-DCG-04 was detected using fluorescently labeled streptavidin. DCG-04: substrate of cysteine cathepsins, E-64: cysteine protease inhibitor, Ca074: cathepsin B inhibitor, 95 °C (neg. control): samples were denaturated prior DCG-04 incubation in order to reveal unspecific binding. G, Quantification of activity blots. Four independently performed activity assays as shown in (F) were quantified by imageJ revealing significantly more active cathepsin B in DEB keratinocytes (t test, two-tailed, two-sample equal variance: p < 0.001). ACTB values (AU) were used for normalization. H–I, Increased autophagic flux in DEB keratinocytes. Regulation of lipidated MAP1LC3B (LC3-II), an autophagosomal marker protein, was analyzed in control and DEB keratinocytes plus/minus concanamycin A (ConA), an inhibitor of the lysosomal V-ATPase, by Western blot (H). Quantification of ConA treated samples compared with untreated samples revealed an increased autophagic flux in DEB keratinocytes (*: p < 0.05, t test, n = 3). J, Increased cathepsin B levels in DEB skin. Immunofluorescence staining of DEB skin revealed a strongly increased cathepsin B signal (green) at the blister roof and in the upper dermis. In healthy control skin cathepsin B occurred mainly at the dermal-epidermal junction and the upper dermis, showing a weaker signal. Blue = DAPI staining.

