Fig. 1.
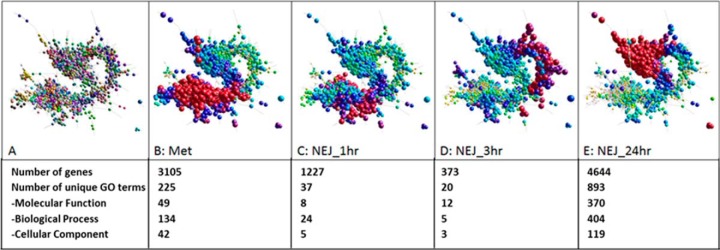
Network graph of the 17901 genes expressed within the first 24 h. A, 3D layout graph represented by 13,559 nodes connected by 765,001 edges at a Pearson correlation threshold of r ≥ 0.97. B–E, Temporal gene expression by the F. hepatica life-cycle stages: metacercariae (met), NEJ 1 h, 3 h, and 24 h post-excystment, respectively. Low levels of gene transcription are depicted by the small node size and the yellow/green node color. Increased gene transcription is represented by an increase in node size and the node color change from yellow/green to blue/purple/red. The number of genes with increased gene transcription at each time point and the number of unique Gene Ontology (GO) terms represented by these genes are shown.

