
Fig. 2.
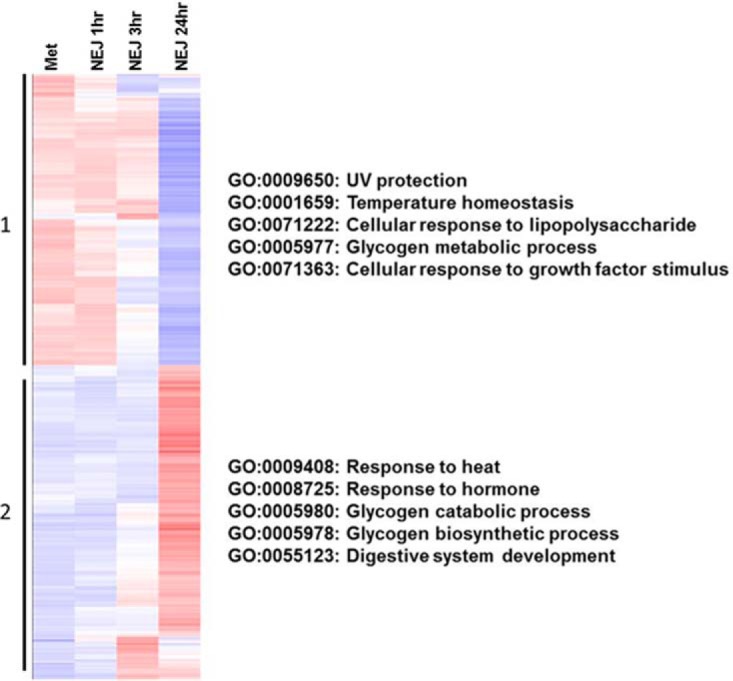
Differential gene expression during the first 24 h. Genes expressed by biological replicates of metacercariae and NEJ 1 h, 3 h and 24 h post-excystment with a baseline cut-off of 2 TPM were grouped by hierarchical clustering, represented by a heatmap (Up-regulation represented in red; down-regulation represented in blue). The 6009 gene models broadly clustered into two groups: (1) Genes up-regulated during the metacercariae and NEJ 1 h stages; (2) Genes showing an up-regulation during the NEJ 3 h and 24 h stages. Gene ontology terms reflecting biological processes associated with each group are shown.