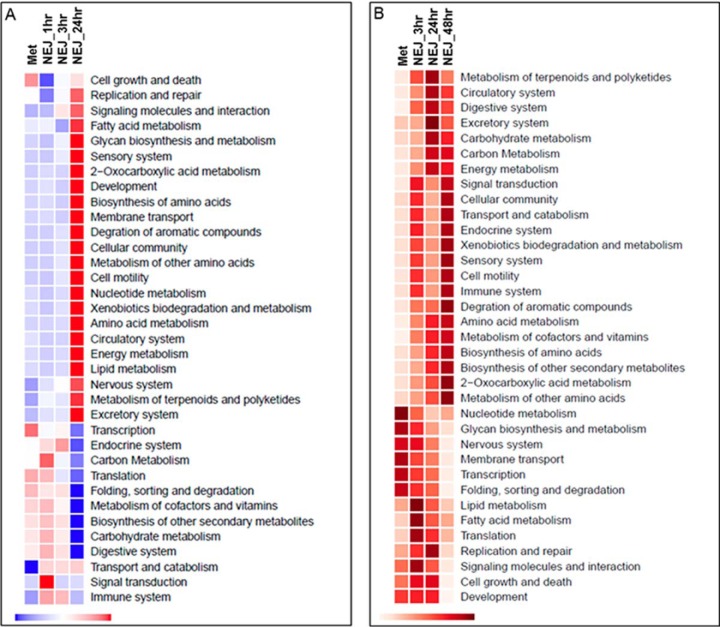
Fig. 4.
F. hepatica metabolism. A, Graphical representation of the transcription of genes associated with the metabolic KEGG modules (ko00001) across the F. hepatica lifecycle within the first 24 h, normalizing the global patterns of expression at the KEGG module level. Relative expression is shown by a blue to red scale depicting low to high levels of expression, respectively. B, Graphical representation of the somatic protein abundance corresponding to the proteins associated with the metabolic KEGG modules (ko00001) within the infective stage, metacercariae and the NEJ up to 48 h post-excystment. The global patterns of expression were normalized at the KEGG module level. Relative protein abundance is shown by light to dark red scale, depicting low to high protein abundance, respectively.

