
Fig. 7.
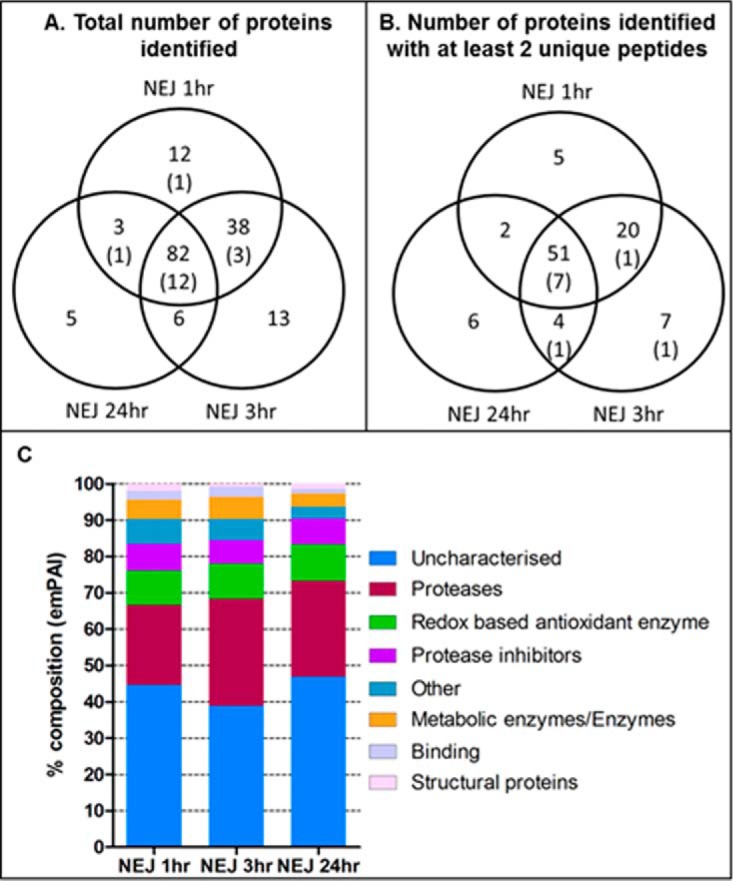
Proteins identified by NEJ secretome analysis. A, Venn diagram representing the mean value of proteins identified within biological replicates of NEJ secretomes (1 h, 3 h, and 24 h post-excystment; 4, 3, and 3 biological replicates, respectively). B, Venn diagram representing those proteins across all three NEJ secretomes with a cutoff of at least 2 unique peptides (biological replicates as above). Those proteins that were uncharacterised are included in brackets. C, Graphical representation of the composition of the NEJ secretomes, based on the emPAI abundance of the different proteins types as a proportion of the total protein secreted.