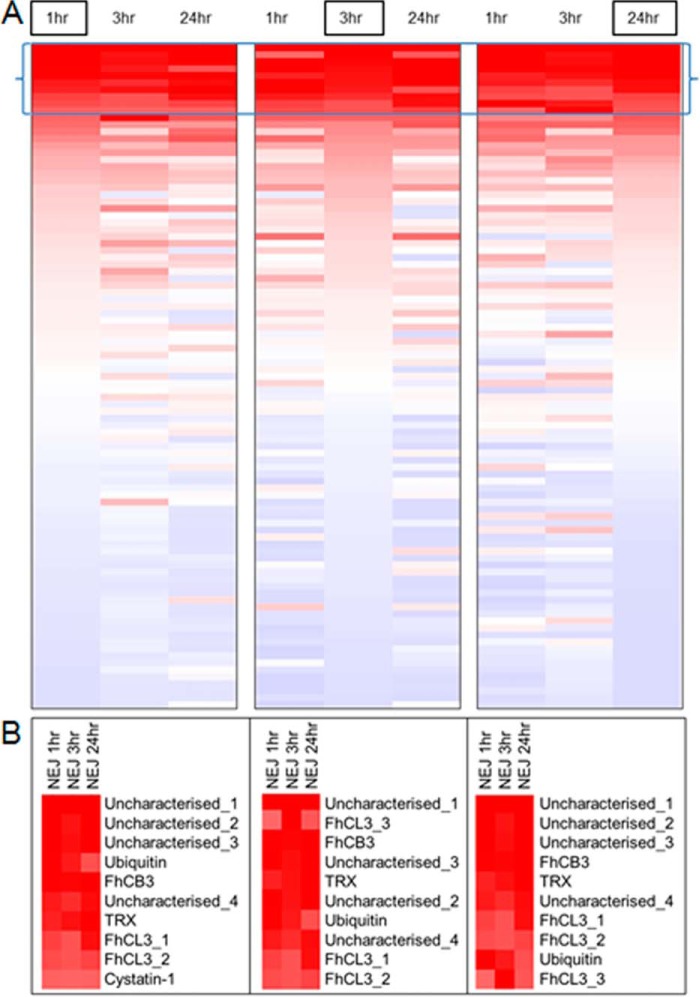
Fig. 8.
Comparison of protein abundance for the NEJ 1 h, 3 h, and 24 h secretomes. A, Each NEJ secretome (1 h, 3 h, and 24 h) is represented as a heatmap ranked by emPAI score for each sample separately, indicated by the boxed sample name. Up-regulation: red; Down-regulation: blue. The top 10 proteins in terms of abundance are indicated within the brackets. B, Highlighted section depicting the top 10 proteins from each heatmap including protein annotation.

