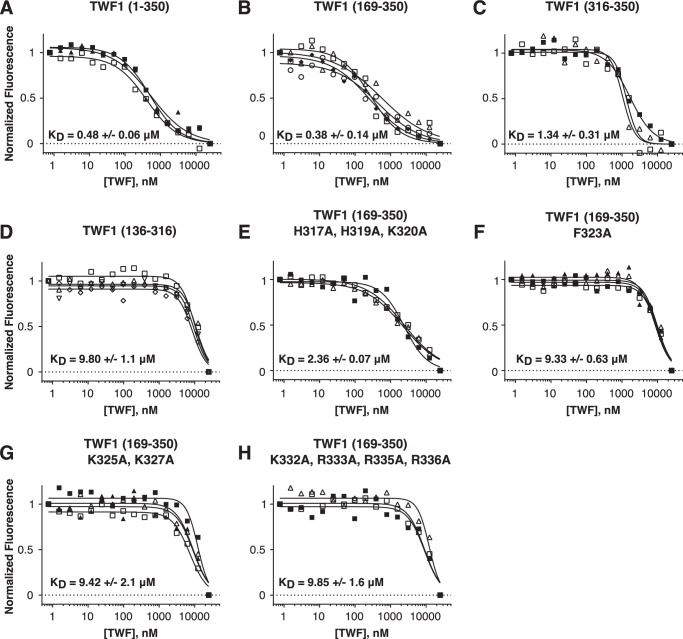
Figure 6.
Microscale thermophoresis (MST) assay demonstrating that the C-terminal tail of twinfilin-1 interacts with capping protein. A–H, the normalized changes in thermophoretic signals with 50 nm EGFP-capping protein in the presence of different concentrations of full-length twinfilin and twinfilin fragments (A–D) or proteins with point mutations in the C-terminal tail (E–H). Each curve represents the fitting of an individual experiment. KD represents a mean of three to four independent experiments, and a standard deviation is shown.

