Figure 5.
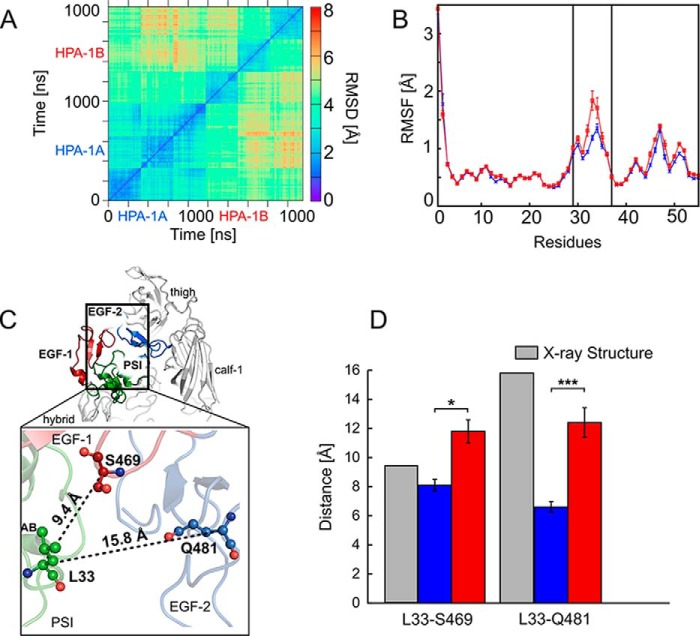
Short- and mid-range structural and dynamics changes induced by the Leu → Pro exchange. A, 2D RMSD plot calculated for the Cα atoms of the EGF-1, EGF-2, and EGF-3 domains after superimposing onto the respective domains. All trajectories accounting for an aggregate simulation time of 2 × 3 μs were considered together in the analysis, excluding the first 200 ns of each trajectory and extracting frames at intervals of 100 ns. B, residue-wise mean backbone RMSF of the PSI domain after a mass-weighted fitting onto the starting structure. Error bars denote S.E. Blue and red curves represent the Leu33 and Pro33 isoforms, respectively; the two black lines delineate the AB loop (residues Glu29–Pro37). C, αIIbβ3 is shown in schematic representation and colored in light gray (with the exception of the PSI domain (green), EGF-1 domain (firebrick), and EGF-2 domain (marine)). Domains are labeled. The enlargement shows the location of the Leu → Pro exchange in the PSI domain within the genu interface of the β3 subunit. Black dashed lines indicate distances computed in D with the distance values of the starting structure reported next to them. Residues Leu33 (PSI domain), Ser469 (EGF-1 domain), and Gln481 (EGF-2 domain) are depicted in ball-and-stick representation. D, mean distances between the Cα atoms of Leu33/Pro33 as well as Ser469 (EGF-1) and Gln481 (EGF-2) calculated for the Leu33 isoform (blue boxes) and the Pro33 variant (red boxes) and measured in the crystal structure (Protein Data Bank code 3FCS; gray boxes). Error bars indicate mean ± S.E., and asterisks denote a significant difference (*, p < 0.05; ***, p < 0.0001) between the two isoforms of αIIbβ3.

