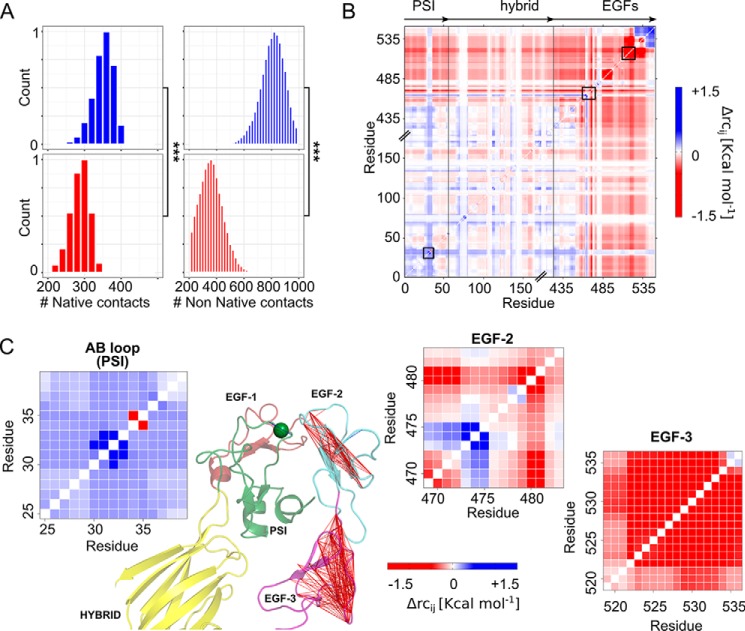
Figure 6.
Changes within the PSI/EGF domain interface and in the structural stability between the Leu33 and Pro33 isoforms. A, shown are the active contacts (left) and non-native contacts (right) formed between the AB loop (PSI domain) and all the side chains located within a distance range of 7 Å. Mean values were computed over three MD simulations of the Leu33 isoform (blue histograms) and Pro33 variant (red histograms). Asterisks denote a significant difference (***, p < 0.0001) between the two isoforms of αIIbβ3. B, difference stability map generated by CNA and averaged over three MD simulations showing the difference in structural stability between both isoforms, focusing on the β3 genu region. The color gradient indicates residues with lower structural stability in the Leu33 (blue) or Pro33 isoform (red). C, enlargements of three areas highlighted within the difference stability map by black boxes (B) and corresponding to the AB loop (PSI domain), residues Ser469–Asp484 (loop connecting the EGF-1 domain to the EGF-2 domain), and residues Gly519–Cys536 (EGF-3 domain), exemplifying changes in structural stability due to the Leu → Pro exchange. The results for the latter two regions are also displayed on the structure of the hybrid (yellow), PSI (green), EGF-1 (firebrick)/EGF-2 (light blue)/EGF-3 (purple) domains of αIIbβ3 (green sphere, Cα atom of residue 33) in terms of lines connecting residues whose mutual stability has decreased in the Pro33 isoform (Δrcij > −1.5 kcal mol−1).

