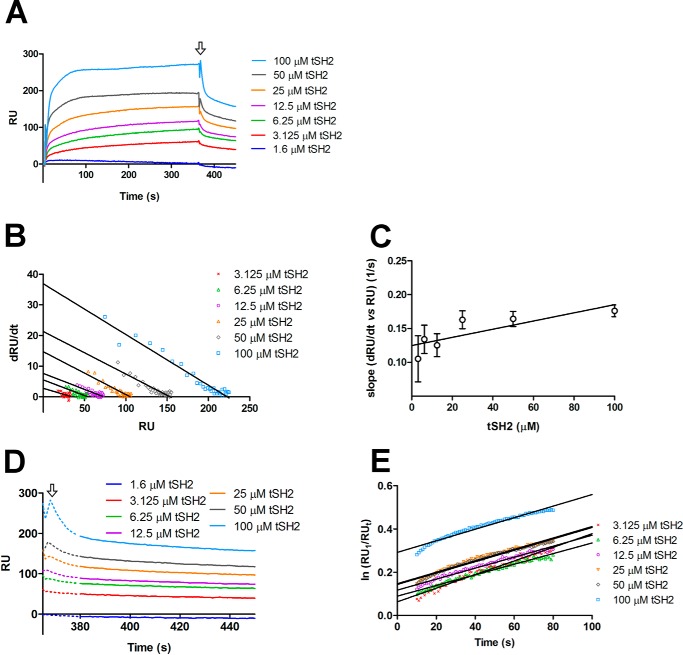
Figure 3.
Interaction between tSH2 and integrin β3 tail. A, SPR experiment where integrin β3 tail peptide was coupled on the surface (ligand) and different concentrations of tSH2 (from 1.3 to 100 μm) were injected (analyte). In the graph is plotted the variation of the RU in the time (s) for each tSH2 concentration tested. The arrow indicates the stop of the injection and, therefore, the beginning of the dissociation phase. B, dRU/dt (variation of RU in time) is plotted against RU (from 10 to 30 s of the association curve, see panel A). Solid lines correspond to the best linear regressions calculated for each tSH2 concentration. C, calculation of association rate constant (kon) of the tSH2–integrin β3 tail peptide complex formation. Error bars are derived from linear regression analysis of panel B in this figure (see “Experimental procedures”). D, variation of RU in the time (s) of the dissociation phase. The arrow indicates the end of injection as in panel A. The dotted line corresponds to the part of dissociation curve that was not used for the determination of the dissociation rate constant (see panel E), whereas the solid line indicates the part that was used. E, variation of ln(RU1/RUt) in time (s), the best linear fits are represented with solid lines. RU1 indicates the response units at the beginning of dissociation phase, and RUt indicates the response units at the time t. The slope of the linear regression corresponds to the dissociation rate constant (koff) (see “Experimental procedures”).

