Figure 3.
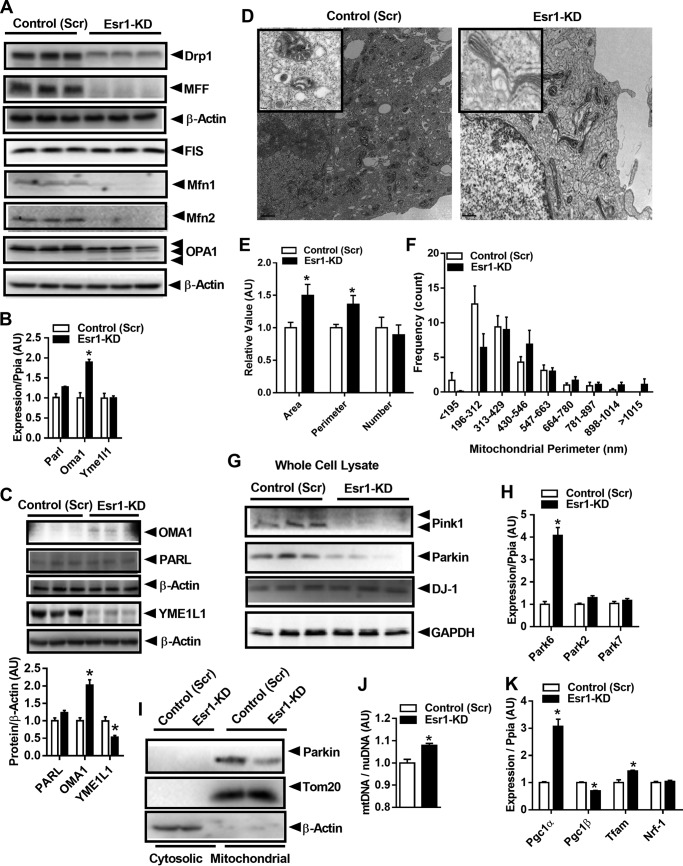
ERα regulates mitochondrial fission/fusion-mitophagy signaling in β-cells. A, immunoblots of select mitochondrial fission and fusion proteins from control (Scr) and Esr1-KD Min6 β-cells (immunoblots presented in A were obtained from the same experiment as immunoblots presented in Fig. 2G; thus, the β-actin immunoblots were duplicated between the panels). B, Parl, Oma1, and Yme1L1 gene expression. C, immunoblots and densitometry quantifying protein abundance in control (Scr) and Esr1-KD Min6 β-cells (n = 6–9/genotype). D, transmission electron microscopy analysis of mitochondria in control (Scr) and Esr1-KD Min6 β-cells (magnification ×2500). E and F, ImageJ analysis of mitochondrial area, perimeter, number, and size frequency in control (Scr) and Esr1-KD Min6 β-cells (four slides/genotype). G, immunoblots of mitophagy-associated proteins in control (Scr) and Esr1-KD Min6 β-cells (n = 6–9/genotype). H, qPCR analyses of mRNA expression of Pink1 (Park6), Parkin (Park2), and DJ1 (Park7) in control (Scr) and Esr1-KD Min6 cells (n = 6–9/genotype in duplicate). I, immunoblots of Parkin in cytosolic and mitochondrial subcellular fractions from control (Scr) and Esr1-KD Min6 cells. J, mtDNA copy number normalized to nuclear DNA (n = 3/genotype in triplicate); K, genes associated with mitochondrial biogenesis (Pgc1a and Tfam) were elevated in Esr1-KD versus control (Scr) Min6 β-cells. Values are mean ± S.E., and mean differences between the groups were detected by Student's t test and ANOVA where appropriate, *, p < 0.05. AU, arbitrary units.

