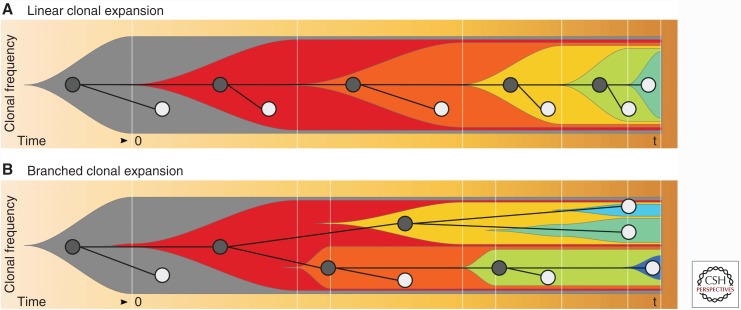
Figure 2.
Fishplots (Miller et al. 2016) of clonal frequencies over time. (A) Linear clonal expansion: Subclones emerge successively and diversity increases linearly over time. The resulting phylogeny is ladder-like. Because of dying out of subclones, diversity at the sampling time point t is relatively low. (B) Branched clonal expansion: Cancer subclones emerge and expand in parallel. Diversity increases quickly, leading to high diversity at the sampling time point (t). The resulting phylogeny is fully branched.

