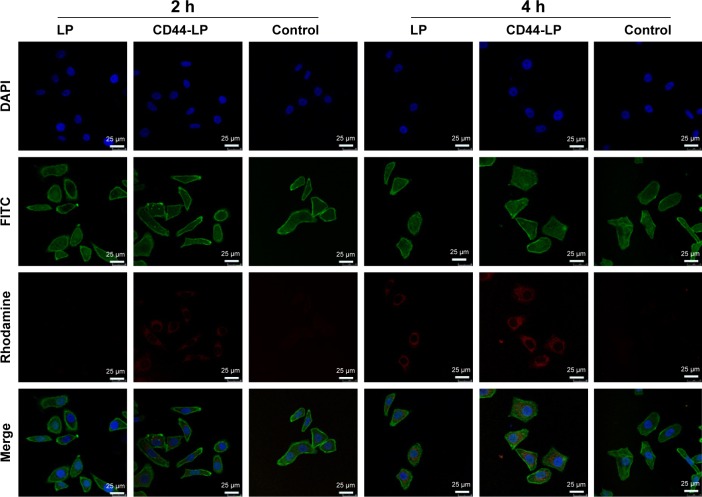
Figure 3.
CLSM images of HepG2 cells following 2 and 4 h incubation with rhodamine-loaded liposomes (40 μg/mL).
Notes: Cells pretreated with CD44 antibody were used as controls. For each panel, the images (top to bottom) show nuclei stained by DAPI (blue), cytoskeleton stained by phalloidin–FITC (green), rhodamine fluorescence in cells (red), and overlays of the three images. Scale bar=25 μm and magnification =630×.
Abbreviations: CLSM, confocal laser scanning microscopy; DAPI, 4′,6-diamidino-2-phenylindole; LP, liposomes.

