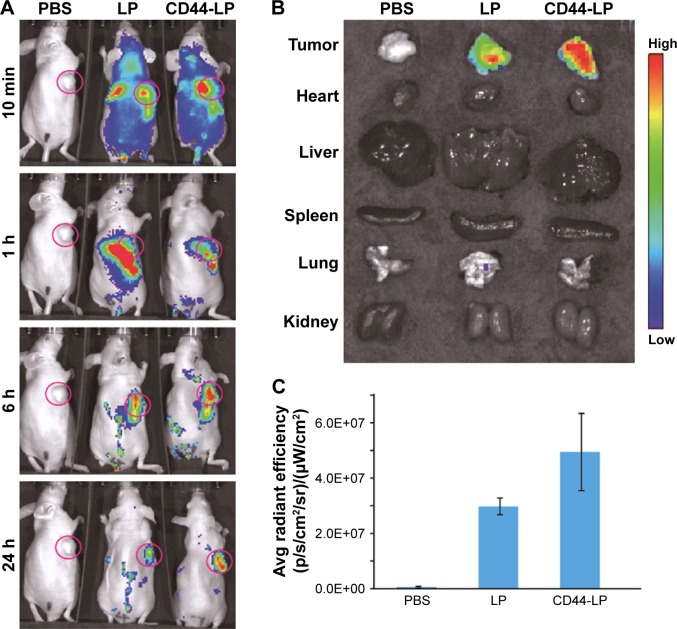
Figure 4.
In vivo biodistribution and ex vivo imaging of HepG2 tumor-bearing mice after tail vein injection of PBS, ICG-loaded LP, and CD44-LP.
Notes: (A) Fluorescence signals obtained from whole-body imaging at 10 min, 1 h, 6 h, and 24 h after administration. (B) Ex vivo fluorescence images of major organs and tumors obtained at 24 h after injection. (C) Semiquantitative analysis of fluorescence intensity for tumors.
Abbreviations: Avg, average; ICG, indocyanine green; LP, liposomes; PBS, phosphate-buffered saline.

