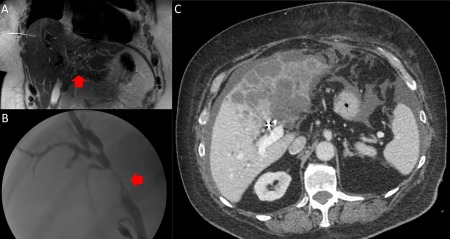
Figure 2.

MRI and ERCP images. (A) Coronal T2 MRI demonstrating an ill‐defined 4.0 × 2.9‐cm hypo‐enhancing lesion in segment III (red arrow) causing obstruction of the intrahepatic biliary ducts (left greater than right). Additionally, there were several hypo‐enhancing satellite lesions in segment II, II, and IVb. (B) Second ERCP with biliary stricture at the bifurcation (red arrow). A plastic biliary was subsequently placed. (C) Axial and coronal images of CT abdomen 5 months after presentation. Bilobar low‐density hepatic masses, loculated ascites, and peritoneal nodular enhancement adjacent to the left hepatic lobe. Abbreviation: MRI, magnetic resonance imaging.
