Figure 3.

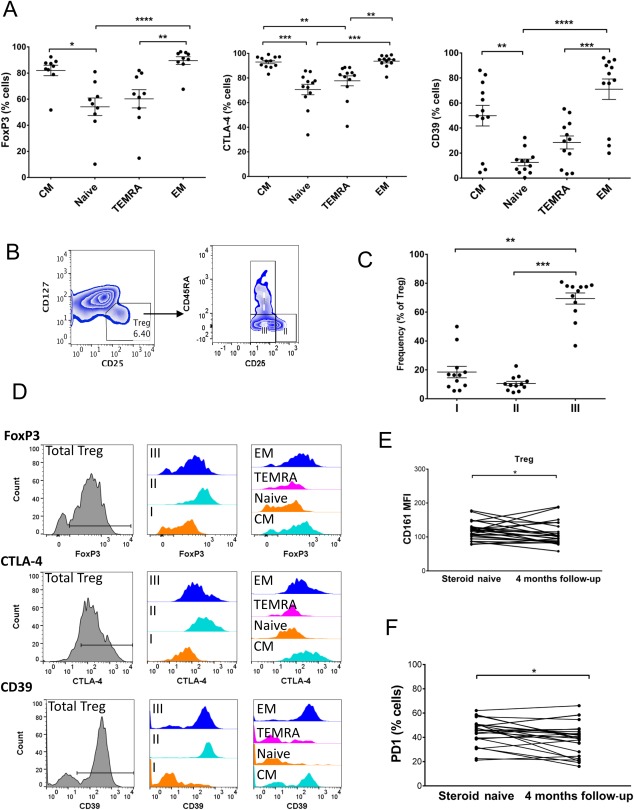
Treg phenotype in acute AIH. (A) Expression of Treg functional proteins FOXP3, CTLA‐4, and CD39 by memory/naive Treg subsets defined as in Fig. 2 by CD45RA and CCR7 expression. (B) Gating strategy for Treg fractions based on CD45RA and CD25 expression. (C) Frequencies of fractions in AIH pretreatment. In A and C, tests were Friedman with Dunn's post‐hoc analysis, *P < 0.05, **P < 0.01, ***P < 0.001, ****P < 0.0001. (D) Representative flow cytometry overlays showing expression of Treg functional proteins FOXP3, CTLA‐4, and CD39 by the total Treg population; fractions I, II, and III Tregs; and the memory and naive Treg subsets. (E) CD161 (MFI) and (F) PD1 (frequency) expression by total Tregs at baseline and after 4 months therapy. Wilcoxon test, *P < 0.05. Abbreviations: CM, central memory; MFI, median fluorescence intensity; TEMRA, terminally differentiated tissue resident effector memory RA‐positive.
