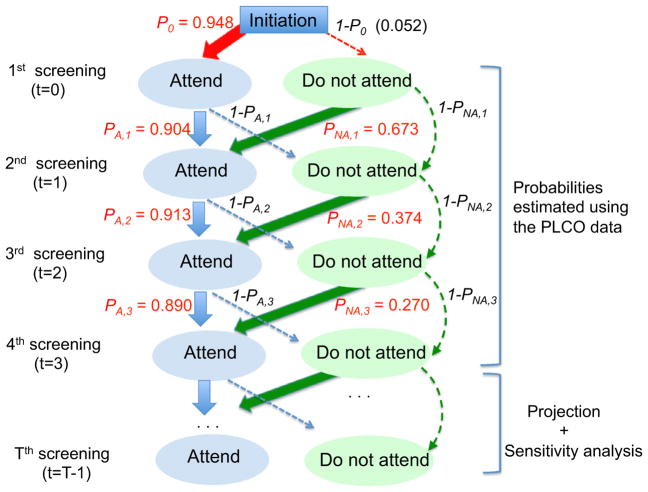
Fig. 1.
Diagram for a Markov model for screening compliance. The numbers in red are the estimates of transition probabilities using the PLCO data. Note In this Markov model, there are two possible states, “attend” or “not attend” and these states are influenced by the states of the previous year. The state of the first screening attendance is decided by initial probability p0 = 0.948 that is estimated using the attendance rate of the first screening from the PLCO data. The state of the second screening is then decided, informed by the state of the first screening. Among those who attended (A) the first screening, the attendance probability of the second screening is pA,1 = 0.904 (PLCO estimation) and 1- pA,1 (= 0.096) for probability of not attending the second screening. For those who did not attend (NA) the first screening, the attendance probability of the second screening is pNA,1 = 0.673 (PLCO estimation). The states of the third through fourth screening are also decided by the states of the screening of the previous year. The PLCO data have only four screenings (T = 0, 1, 2, and 3), and hence transition probabilities estimated based on four years were extrapolated for T ≥ to be used for evaluating the impact of the lifetime USPSTF-recommended screen program and varied for sensitivity analysis (see Methods “Evaluation of the USPSTF-recommended and the NLST-like screening program with lifetime screening and follow-up”)

