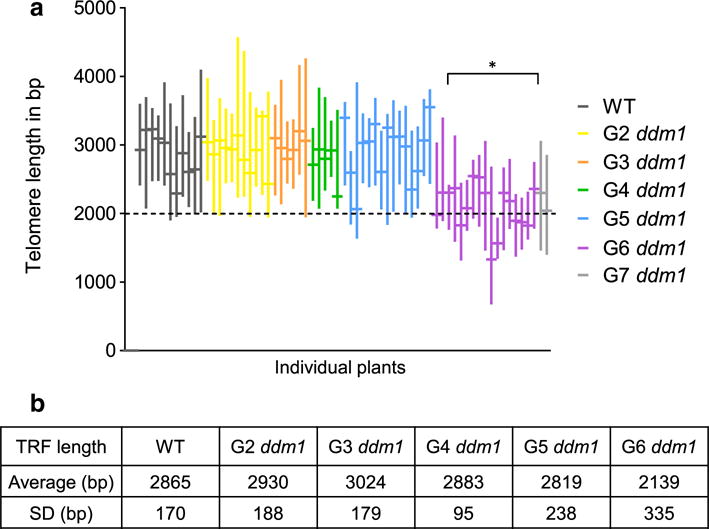
Fig. 2.

Telomere length quantification of different generations of ddm1-2 mutants using Telo-Tool. a Graphic representation of the telomere length range (vertical lines) and mean TRF (horizontal bars) of individual WT and ddm1 mutants. Dashes indicate the 2 kb threshold for minimal telomere length in WT. The asterisk indicates that mean telomere length of G6 ddm1 plants is significantly different from G5 ddm1 (p value < 0.01, t test). b Compiled data for telomere length analysis of each generation. SD standard deviation
