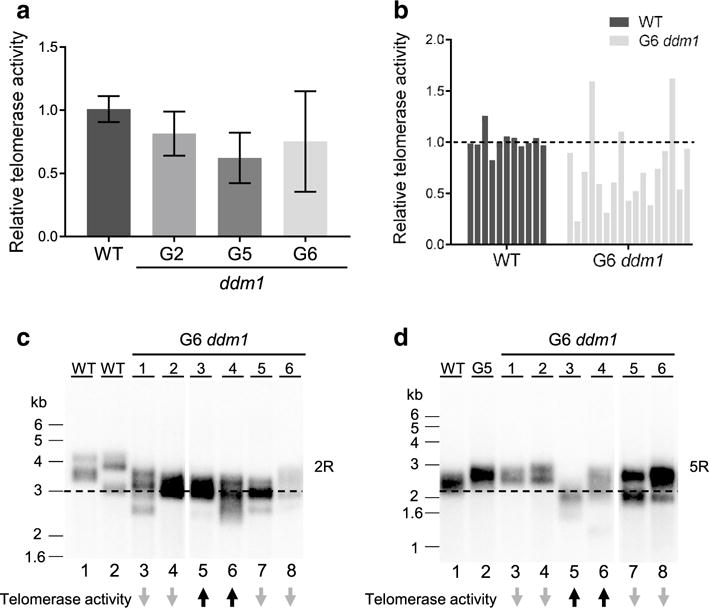
Fig. 3.

Telomerase activity in ddm1 mutants. a qTRAP results showing relative telomerase activity from flowers of ddm1 mutants. The average WT level of telomerase activity was set as 1. Each data point represents analysis of at least three biological replicates with two technical replicates. The standard deviation between biological replicates is represented by error bars. b Relative telomerase activity in individual WT and G6 ddm1-2 mutants is plotted. c, d Telomere length analysis for individual WT and G6 ddm1-2 mutants on specific chromosome arms using the PETRA assay. Representative data for the right arm of chromosome 2 (2R) are presented in c and for the right arm of chromosome 5 (5R) in d. The relative change in telomerase activity for each G6 ddm1 mutants is shown on the bottom. Upward black arrows indicate an increase in telomerase activity compared with WT; downward grey arrows indicate a decrease in telomerase activity for these specific samples. Dashes indicate the minimal telomere length in WT samples
