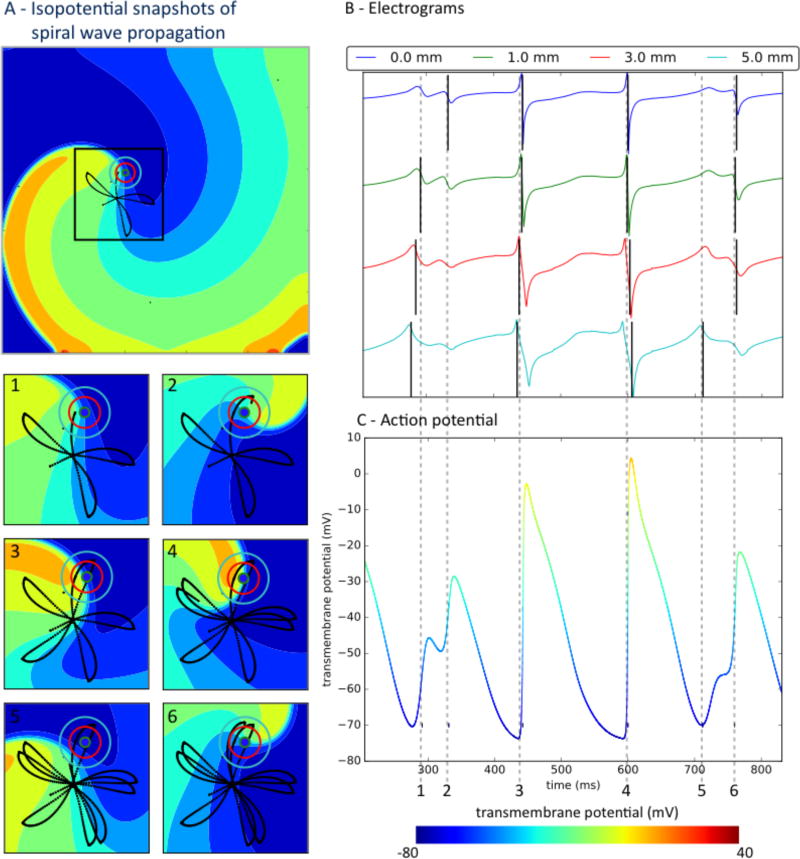
Figure 2.
Precessing spiral wave trajectory causes variable atrial fibrillation electrograms; with similar local and far-field components on clinically sized electrodes. A) Isopotential snapshots of the spiral wave. Insets 1–6 show zoomed views with black lines representing spiral tip trajectory, at times referenced to electrograms. B) Electrograms for electrodes of diameters marked by concentric circles in panel A. Recorded activity depends on electrode size independent of spacing. C) Transmembrane action potentials. Time 1 indicates non-local activity from a passing wave, especially on larger electrodes. At time 2, low amplitude signals reflect tight turn of the spiral tip. At times 3 and 4, electrograms represent activation. Time 5 represents non-local activation from the nearby passing wave, which is difficult to separate from the next true activation at time 6. Vertical black lines mark onset (minimum dV/dt) in each electrogram.

