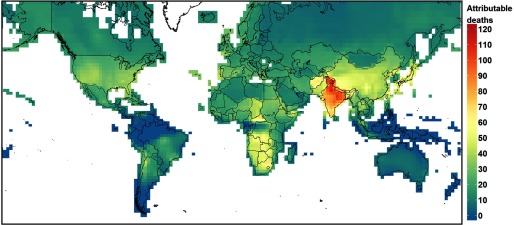
Figure 1.
Estimated long-term -exposure attributable respiratory deaths in 2010 for adults of age. Units are attributable deaths per 100,000 people, and estimates were derived using the T2016 relative risk estimate [ (95% CI: 1.08, 1.16), adjusted for near-source and regional , and exposure] and annual average daily maximum 8-h concentration as the exposure metric, with a low-concentration cutoff set at the minimum exposure in the Turner et al. (2016) cohort () (Map Data: © EuroGeographics for the administrative boundaries).

