Figure 3.
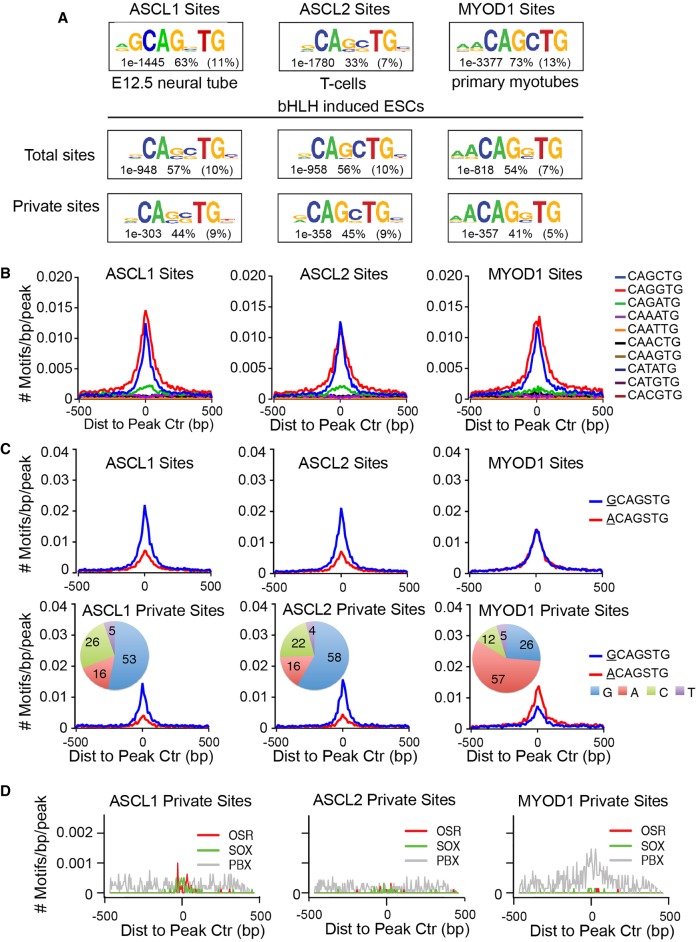
ASCL1, ASCL2, and MYOD1 bind similar motifs. (A) Comparison of primary Ebox motifs identified by de novo motif discovery in ChIP-seq for ASCL1, ASCL2, and MYOD1 from differentiated tissues, as indicated, and the ESCs with the ectopic factors using a 50 bp interval centered on the peak apex. Comparative motifs in differentiated cell types were generated from previously published data sets for ASCL1 (Borromeo et al. 2014), ASCL2 (Liu et al. 2014), and MYOD1 (Cao et al. 2010). Numbers reflect the P-value significance of the specified motif, the percent incidence of the specific motif shown in ChIP-seq peak regions, and the percent incidence in a normalized random background set. (B,C) Frequency and distribution of Ebox motifs (B), or expanded Eboxes (C), across a 1-kb interval surrounding peak centers. Each colored plot represents the rate of Ebox occurrence for one Ebox permutation as indicated. (D) Frequency and distribution of primary and secondary motifs identified by de novo motif discovery within a 1-kb interval centered on peak apex from ASCL1 and MYOD1 binding sites. Text indicates the motif specified and the factor family predicted to bind the motif.

