Figure 5.
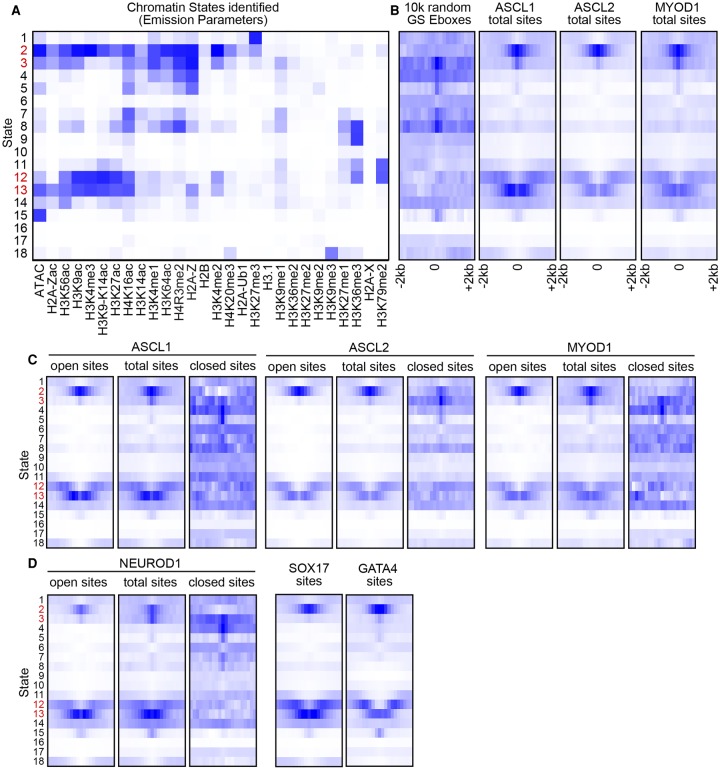
ASCL1, ASCL2, and MYOD1 bind similar chromatin states enriched with active features. (A) Chromatin states (Ernst and Kellis 2012) identified by hidden Markov modeling of chromatin features identified by ChIP-seq and ATAC-seq in ESCs from published data sets and data generated in this study. The strength of the state association with each chromatin feature (columns) is indicated by increasing color intensity. States indicated in red represent those highlighted in text. (B–D) State enrichment diagrams of genomic sites identified by random CAGSTG Ebox sites and ASCL1, ASCL2, and MYOD1 ChIP-seq (B), by bHLH ChIP-seq binned into those sites in open versus closed chromatin from Figure 4A (C), and by additional TF binding sites for comparison (D). Each plot represents the degree of association of the sites (color intensity) versus the states indicated in A in the 4-kb interval centered on the ChIP-seq peak apex. See Methods for a list of GEO accession numbers for all data sets used.

