Figure 6.
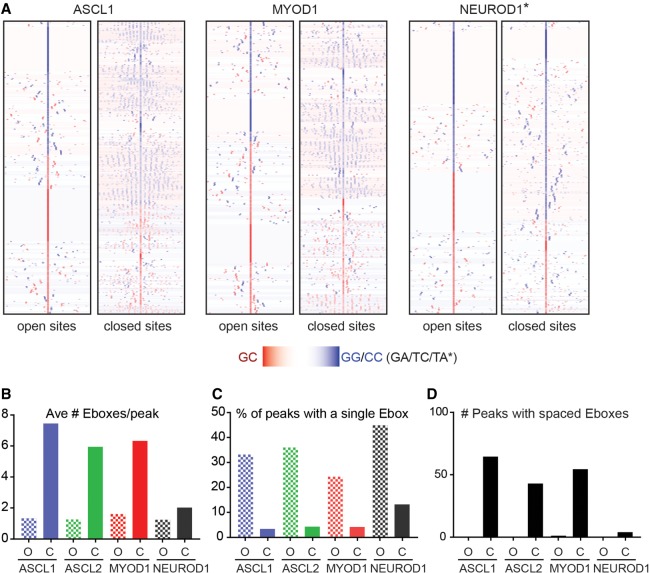
Unique stereotypical patterning of Ebox motifs in ASCL1-, ASCL2-, and MYOD1-bound sites specifically in closed chromatin. (A) Heatmap comparison of CAGSTG Ebox motifs identified in the upper and lower quartile of binding sites identified by ChIP-seq for each factor, as indicated, reflecting the same peaks as shown in Figure 4A. NEUROD1 quartiles were determined based on chromatin accessibility in uninduced ESCs, as assayed by ATAC-seq. Plots reflect cluster analysis of the distribution of each motif, with peak coordinates computationally centered on the CAGSTG Ebox motif closest to the peak apex, within ±25 bp of peak apex, and visualized across 300 bp, centered on the motif specified. Peak intervals lacking a CAGSTG motif within this interval are not shown in this comparison. (B) The average number of CAGSTG Ebox motifs per peak (within 300 bp) around bHLH bound regions identified in open (O) chromatin or closed (C) as determined by ATAC-seq on uninduced ESCs. (C) The percentage of total bHLH bound regions featuring a single Ebox motif in chromatin defined as open versus closed. (D) Number of peaks featuring the spatially patterned CAGSTG Ebox motifs as shown in A, demonstrating that this feature is restricted to closed chromatin and is not a feature of all class II bHLH TF.

