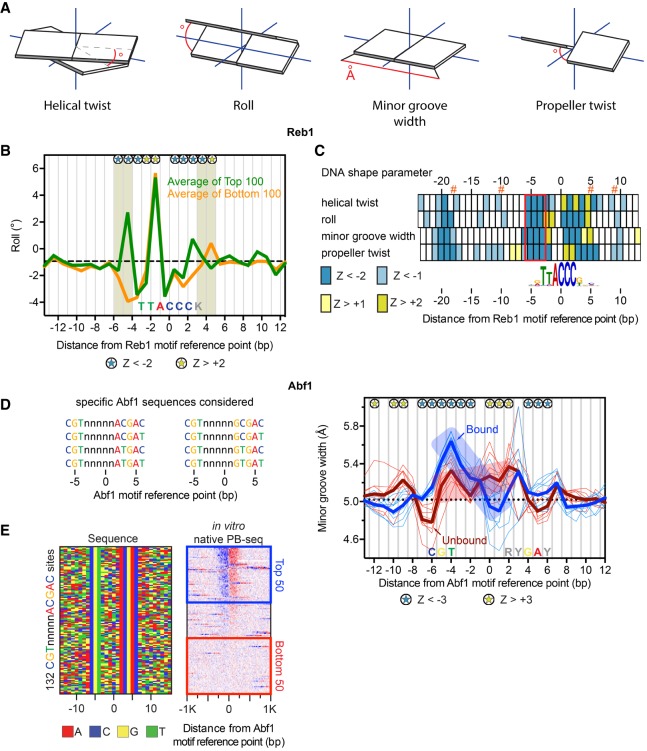
Figure 3.
Distinct DNA shape features help define Reb1 and Abf1 binding. (A) DNA shape parameters. The angle or distance reported for each parameter is indicated by red lines. (B) Line plots of variations in roll for top versus bottom 100 promoter Reb1 motif occurrences, defined by the sort in Supplemental Figure S3A. Dashed black line denotes genome-wide median. Blue and yellow stars represent positions with significant positive or negative roll (|Z| > 2, Mann-Whitney U test), respectively, for the top versus bottom 100. Shaded boxes highlight the nucleotides outside the core motif with significant shape differential. (C) Heat map representation of four DNA shape parameters for Reb1 from B. Z-scores are based on the Mann-Whitney U test. Orange hashtags indicate the location of Reb1 cross-linking points. The red box highlights the region of the motif with the greatest concentration of significant positions across all four DNA shape parameters. Helical twist and roll are inter-bp values. (D) List of specific sequences considered as exact Abf1 motif occurrences. (E) Four-color plot of sequences (left) centered on the motif midpoint for all instances of CGTnnnnnACGAC in promoters, representing one of the eight specific sequence configurations. (Right panel) Heat map of tags sorted by native PB-seq. The blue and red boxes indicate the top versus bottom 50 occupied sites. (F) Line plots of variations in minor groove width for Abf1 motif occurrences. Blue/bound or red/unbound thick lines represent the average of the thin lines, which reflect shape profiles for the eight individual Abf1 motif configurations. The dashed black line indicates the genome-wide median. Blue and yellow stars represent positions with significant larger or smaller minor groove width (|Z| > 3, Mann-Whitney U test), respectively, for the combined top versus bottom 400 sites. The position of the consensus Abf1 motif is labeled along the x-axis.

