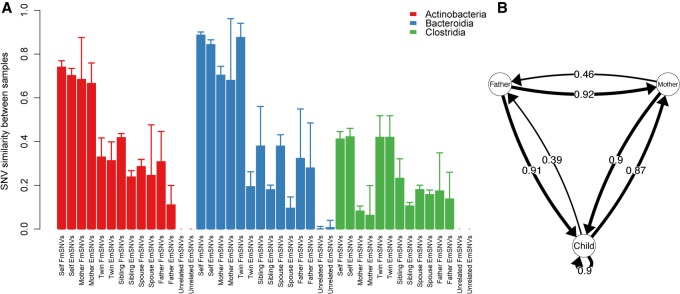
Figure 4.
Strain similarity and transmissions within families. (A) The bars indicate mean ± SD. Two sets of rare marker SNVs were defined per pair of individuals: rare marker SNVs, which were allowed to be shared with other family members (marked here as Family marker SNVs, FmSNVs), and exclusive marker SNVs (EmSNVs), which were only shared between the compared pair. (B) The arrows indicate the cases where novel SNVs emerging in the focal individual were observed in previous time points of a given family member. The arrow from child to child indicates transmission between siblings. The numbers on the arrows represent the proportion of identified transmission events between the indicated pair of family members (number of observed transmission events/total number of family member comparisons).

