
Fig. 2. HpiC1 structural overview at 1.5 Å.
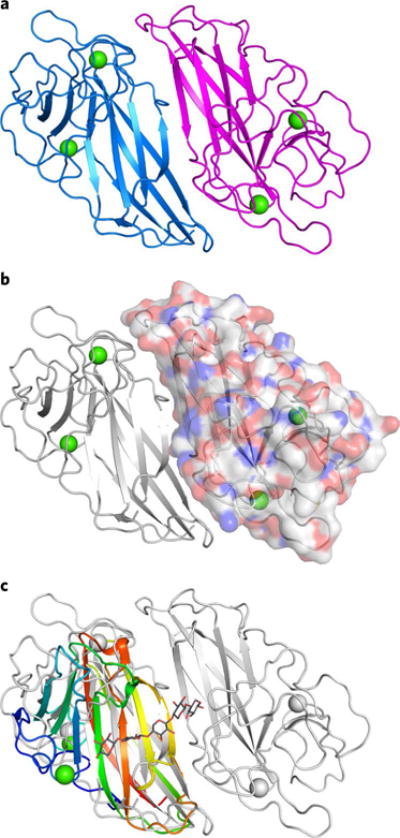
a, Cartoon representation of the HpiC1 homodimer. The subunits are colored blue and magenta; green spheres indicate bound calcium ions. b, Surface representation of a single HpiC1 protomer, colored by atom, indicates 2,060 Å2 of buried surface area between the subunits. c, Superposition of HpiC1 with a xylanase carbohydrate-binding module (CBM) homolog (PDB ID 2Y64, rainbow); CBM is monomeric despite sharing the same fold as HpiC1.