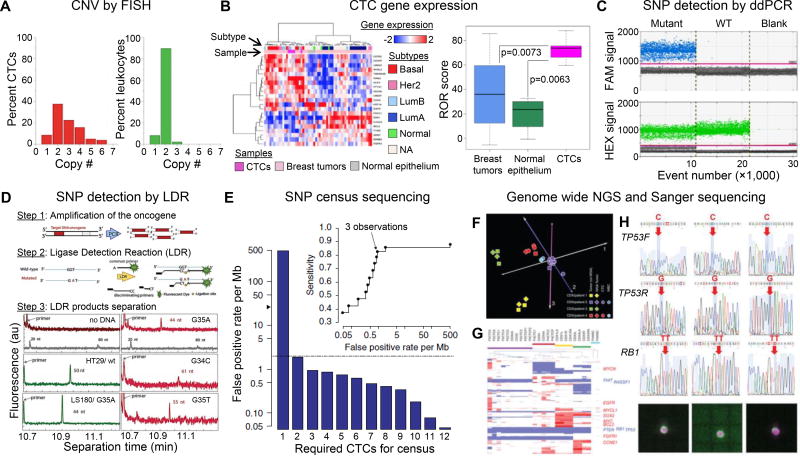
Figure 1. CTC molecular analyses.
(A) Histogram of the copy number of chromosome 8 detected in CTCs (red bars) and leukocytes surrounding CTCs (green bars) using FISH. Reproduced from41 with permission. (B) Exploratory analysis based on the subset of 21 genes from the PAM50 classifier. CTCs were clustered with the more aggressive breast cancer subtypes (HER2 positive and Luminal B based on a 90% confidence interval (p < 0.01) for assigning PAM50 subtype based on the available probes in the cDNA microarray. CTCs derived from Stage IV patients had a higher risk of recurrence score in comparison to I-SPY1 primary tumors. Reproduced from43 with permission. (C) 1D-Dot plot from ddPCR. The blue histogram indicates the number of droplets considered as positive for mutant KRAS according to the fluorescence threshold. The green histogram corresponds to the number of wild-type droplets. Mutant control, DNA containing a 1:1 mix of mutant and wildtype KRAS. WT control, DNA containing only KRAS wild-type. Blank, water. Reproduced from44 with permission. (D) Schematic of the polymerase chain reaction/ligase detection reaction (PCR/LDR) assay, and electropherograms of LDR products for: no gDNA; HT29 wt35 (50 nt); LS180 G35A (44 nt); and CTC isolated form metastatic pancreatic cancer patient: mesenchymal CTCs G35A (44 nt), epithelial CTCs G34C (61 nt); and another mesenchymal CTCs G35T (55 nt). The gray trace shows the DNA markers. Reproduced from6 with permission. (E) Estimation of false-positive rate per Mb among 19 independent CTC libraries after requiring the variant to be observed in at least nine of the CTC libraries. The gray dashed line indicates the reported mutation rate in bulk tumor sequencing of treated prostate cancer (~2 per Mb); the black arrowhead indicates the false-positive rate per Mb observed for a single CTC library. The inset shows sensitivity versus false-positive rate per Mb as a function of the required number of independent observations of the variant. Single CTCs, pools of ten CTCs and pools of ten WBCs isolated from patients were whole genome amplified along with 1 ng of DNA from CDXs. CNV analysis was carried out on the amplified material and unamplified tumor DNA. Reproduced from26 with permission. (F) Principal component analysis of genome-wide CNV data. (G) Hierarchical clustering of CNVs of 6,341 selected cancer-related genes. The positions of 13 genes showing frequent gains or losses in SCLC are indicated to the right of the heatmap. (H) Sanger sequencing of the RB1 and TP53 mutations (detected in CDX2) in six single CTCs, two pools of ten CTCs and a pool of ten WBCs isolated from patient 2, with images of a cytokeratin-stained single CTC from DEPArray. Red arrows indicate somatic mutations, and blue arrows indicate the corresponding unmutated regions. Panels F–H reproduced from37 with permission.

