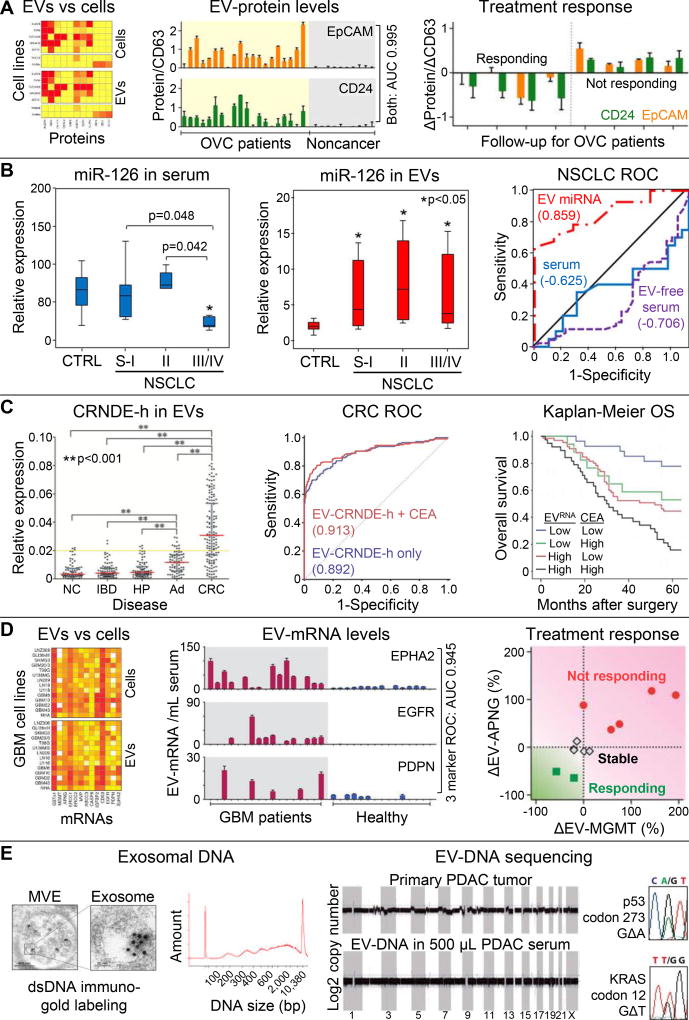
Figure 3. EV molecular analyses.
(A) Comparison of putative EOC markers and immune markers shows concordant protein expression on EVs (surface plasmon resonance-based analysis) and EOC and benign cell lines (flow cytometry). Elevated EV-EpCAM and EV-CD24 levels (normalized to EV-CD63) were associated with EOC ascites (N=20) whereas negligible signals were observed for non-cancer patients (N=10). Receiver operating characteristic (ROC) analysis showed an area under the curve (AUC) of 0.995 when the EV-EpCAM and EV-CD24 markers were combined. Longitudinal monitoring of EOC patients treated with chemotherapy (N=8) showed decreasing EV-EpCAM and EV-CD4 levels correlating with treatment response. Reproduced from50 with permission. (B) Levels of miR-126 in NSCLC patients were tested in bulk serum and within EVs specifically. EV-miR-126 fraction provide superior clinical sensitivity/specificity for NSCLC patients throughout localized (N=26) and metastatic (N=19) disease compared to healthy controls (N=31), which is illustrated by ROC analysis (AUC = 0.859). Reproduced from54 with permission. (C) Expression of the lncRNA marker CRNDE-h was elevated in EVs derived from CRC patients (N=148) as compared to patients with a normal colonoscopy (NC; N=80), hyperplastic polyp (HP; N=80), inflammatory bowel disease (IBD; N=80), and adenoma (AD; N=80). ROC analysis and Kaplan-Meier analysis of 5-year overall survival show that combination with the CEA biomarker shows improved sensitivity/specificity (AUC 0.913) and prognostic value of the EV-CRNDE-h marker. Reproduced from19 with permission. (D) EVs and parental GBM cell lines show concordant mRNA expression for 14 mRNA markers. When combined, three EV-mRNA markers could differentiate GBM patients (N=17) from healthy controls (N=15) with high clinical sensitivity/specificity (AUC 0.945), and downregulation of two other EV-mRNA markers correlated with chemotherapy response in 11 serial measurements of GBM patients (N=7). Reproduced from57 with permission. (E) TEM imaging of MVEs in pre-senescent fibroblasts with immuno-gold labeling of dsDNA, depicted as black dots, which shows the presences of dsDNA in exosomes that spans a broad size range (Bioanalyzer analysis). Reproduced from58 with permission. Shotgun whole genome sequencing of EV-DNA from a PDAC patient’s serum shows genome-wide coverage, but CNVs in the patient’s primary tumor are not reflected in EV-DNA. Sanger sequencing of EV-DNA from one PDAC patient revealed a KRAS and TP53 mutation. Reproduced from59 with permission.

